Physicochemical Properties
| Molecular Formula | C50H47CL2N3O6 |
| Molecular Weight | 856.830691576004 |
| Exact Mass | 855.284 |
| CAS # | 1246826-07-2 |
| Related CAS # | TT-OAD2;2382719-60-8 |
| PubChem CID | 58327143 |
| Appearance | Typically exists as solid at room temperature |
| LogP | 8.2 |
| Hydrogen Bond Donor Count | 2 |
| Hydrogen Bond Acceptor Count | 8 |
| Rotatable Bond Count | 13 |
| Heavy Atom Count | 61 |
| Complexity | 1400 |
| Defined Atom Stereocenter Count | 4 |
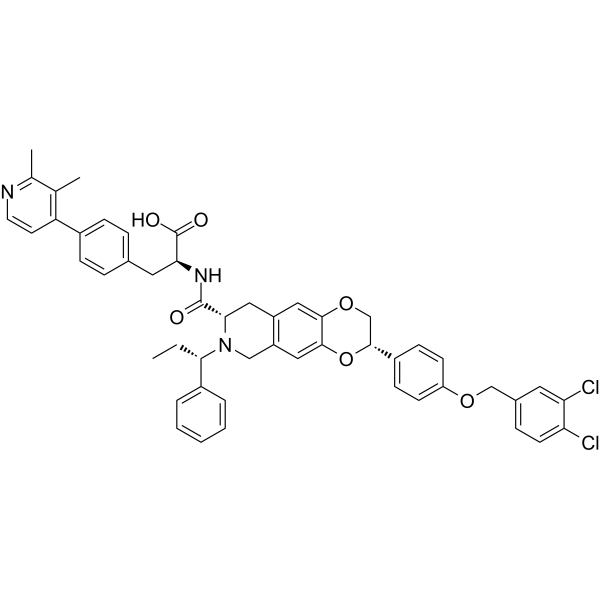
| SMILES | CC[C@@H](C1=CC=CC=C1)N2CC3=CC4=C(C=C3C[C@H]2C(=O)N[C@@H](CC5=CC=C(C=C5)C6=C(C(=NC=C6)C)C)C(=O)O)OC[C@@H](O4)C7=CC=C(C=C7)OCC8=CC(=C(C=C8)Cl)Cl |
| InChi Key | DEDPYBWOUXWMOX-ZTAAISNPSA-N |
| InChi Code | InChI=1S/C50H47Cl2N3O6/c1-4-44(35-8-6-5-7-9-35)55-27-38-26-47-46(60-29-48(61-47)36-15-17-39(18-16-36)59-28-33-12-19-41(51)42(52)22-33)25-37(38)24-45(55)49(56)54-43(50(57)58)23-32-10-13-34(14-11-32)40-20-21-53-31(3)30(40)2/h5-22,25-26,43-45,48H,4,23-24,27-29H2,1-3H3,(H,54,56)(H,57,58)/t43-,44-,45-,48+/m0/s1 |
| Chemical Name | (2S)-2-[[(3S,8S)-3-[4-[(3,4-dichlorophenyl)methoxy]phenyl]-7-[(1S)-1-phenylpropyl]-3,6,8,9-tetrahydro-2H-[1,4]dioxino[2,3-g]isoquinoline-8-carbonyl]amino]-3-[4-(2,3-dimethylpyridin-4-yl)phenyl]propanoic acid |
| Synonyms | (S)-2-((3S,8S)-3-(4-((3,4-Dichlorobenzyl)oxy)phenyl)-7-((S)-1-phenylpropyl)-2,3,6,7,8,9-hexahydro-[1,4]dioxino[2,3-g]isoquinoline-8-carboxamido)-3-(4-(2,3-dimethylpyridin-4-yl)phenyl)propanoic acid; TT-OAD2 free base; GLP-1 receptor agonist 5; SCHEMBL539630; CHEMBL3950796; |
| HS Tariff Code | 2934.99.9001 |
| Storage |
Powder-20°C 3 years 4°C 2 years In solvent -80°C 6 months -20°C 1 month |
| Shipping Condition | Room temperature (This product is stable at ambient temperature for a few days during ordinary shipping and time spent in Customs) |
Biological Activity
| Targets | EC50: 5 nM (GLP-1 receptor)[2] |
| ln Vitro | In HEK293A cells, TT-OAD2 (0-10 μM) concentration-dependently suppresses GLP-1- and oxyntomodulin-mediated cAMP, calcium, pERK1/2, and β-arrestin responses[1]. |
| ln Vivo | Humanized GLP-1R knock-in (KI) and GLP-1R knock-out (KO) mice treated with TT-OAD2 (3 mg/kg; intravenous injection; male human GLP-1 receptor knock-in and knockout mice) produce plasma insulin in an acute IVGTT[1]. |
| Enzyme Assay |
NanoBRET ligand binding[1] HEK293A cells were transiently transfected with Nluc-hGLP-1R. Forty-eight hours after transfection, cells were collected and plasma membrane was extracted as described previously31. Cell membrane (1 μg per well) was incubated with furimazine (1:1,000 dilution from stock) in assay buffer (1× HBSS, 10 mM HEPES, 0.1% (w/v) BSA, 1× P8340 protease inhibitor cocktail, 1 mM DTT and 0.1 mM PMSF, pH 7.4). RhodamineX-Ex4 (Rox-Ex4) was used as fluorescent ligand in the NanoBRET binding assay. BRET signal between Nluc-hGLP-1R and Rox-Ex4 was measured using PHERAstar at 10 s interval (25 °C), a 2 min baseline was taken before addition of Rox-Ex4 (Kd concentration 3.16nM, determined previously), the measurement continued for 15 min followed by adding increasing concentration of TT-OAD2, or unlabelled Ex4 as a control. Data were corrected for baseline and vehicle treated samples. cAMP kinetics studies[1] HEK293A cells (confirmed mycoplasma negative) were transfected with an Epac-cAMP sensor and human GLP-1R at an optimized ratio. Ligand-mediated cAMP production was measured 48 h after transfection. In brief, culture media was replaced with assay buffer (1× HBSS, 10 mM HEPES, 0.1% BSA, pH 7.4). BRET signals were measured at 1 min intervals using a PHERAstar plate reader (BMG LabTech) in the absent or present of increasing concentration of ligands. Forskolin (100 μM) was used as a positive control, and data were normalized to the forskolin response. ERK1/2 phosphorylation assays[1] HEK293 cells (confirmed mycoplasma negative) expressing stably expressing the GLP-1R were seeded at a density of 30,000 cells per well into 96-well culture plates and incubated overnight at 37 °C in 5% CO2. Receptor-mediated pERK1/2 was determined using the AlphaScreen ERK1/2 SureFire protocol as previously described14. Data were normalized to the maximal response elicited by 10% FBS determined at 6 min. In one series of experiments, vehicle or increasing concentrations of TT-OAD2 was added 30 min before assay of peptide response. |
| Cell Assay |
Ca2+ mobilization assays[1] HEK293 cells (confirmed mycoplasma negative) stably expressing the GLP-1R were seeded at a density of 30,000 cells per well into 96-well culture plates and incubated overnight at 37 °C in 5% CO2, and receptor- mediated intracellular calcium mobilisation determined as previously described65. Fluorescence was determined immediately after ligand addition, with an excitation wavelength set to 485 nm and an emission wavelength set to 520 nm, and readings taken every 1.36 s for 120 s. The peak value was used to create concentration-response curves. Data were normalized to the maximal response elicited by 100 μM ATP. In one series of experiments, vehicle or increasing concentrations of TT-OAD2 was added 30 min before assay of peptide response. β-arrestin recruitment assays[1] HEK293 cells (confirmed mycoplasma negative) were transiently transfected with GLP-1R-Rluc8 and β-arrestin1-Venus at a 1:4 ratio and seeded at a density of 30,000 cells per well into 96-well culture plates and incubated for 48 h in DMEM containing 5% FBS at 37 °C in 5% CO2. β-arrestin recruitment was performed as previously described66. In one series of experiments, vehicle or increasing concentrations of TT-OAD2 was added 30 min before assay of peptide response. cAMP accumulation assays[1] HEK293 cells (confirmed mycoplasma negative) were seeded at a density of 30,000 cells per well into 96-well culture plates and incubated overnight in DMEM containing 5% FBS at 37 °C in 5% CO2. cAMP detection was performed as previously described in the presence of the phosphodiesterase inhibitor 3-isobutyl-1-methylxanthin65. All values were converted to cAMP concentration using a cAMP standard curve performed in parallel and data were subsequently normalized to the response of 100 μM forskolin in each cell line. In one series of experiments, vehicle or increasing concentrations of TT-OAD2 was added 30 min before assay of peptide response. |
| Animal Protocol |
Animal/Disease Models: Male human GLP-1 receptor knock-in and knockout mice (6-11 months of age) with intravenous (iv) glucose tolerance tests[1] Doses: 3 mg/kg Route of Administration: intravenous (iv) injection (Single dose) Experimental Results: Induced plasma insulin. In vivo IVGTT assays[1] Intravenous glucose tolerance tests were performed in male human GLP-1R knock-in and knockout mice (all on C57/BL6 background). Catheters were placed in the right carotid artery and left jugular vein of mice 6–11 months of age. Approximately one week later, mice (n = 4–5 per group) were fasted overnight and the catheters were exteriorized as mice acclimated to test cages. Vehicle (5% DMSO, 20% Captisol in NaHPO4, pH 2, 1 ml kg−1), GLP-1(7-36)NH2 at 10 μg kg−1, GIP(1-42) at 25 μg kg−1, or OAD2 at 3 mg kg−1 was administered intravenously one minute before glucose load (0.5 g kg−1). Blood samples were collected at −10, 0, 2, 4, 6, 10, 20 and 30 min to determine blood glucose concentrations via glucometer and plasma insulin measurement.[1] |
| References |
[1]. Zhao P, et al. Activation of the GLP-1 receptor by a non-peptidic agonist. Nature. 2020 Jan;577(7790):432-436. [2]. Transtech Pharma, et al. Substituted azoanthracene derivatives, pharmaceutical compositions, and methods of use thereof. WO2010114824A1. |
| Additional Infomation | Class B G-protein-coupled receptors are major targets for the treatment of chronic diseases, including diabetes and obesity1. Structures of active receptors reveal peptide agonists engage deep within the receptor core, leading to an outward movement of extracellular loop 3 and the tops of transmembrane helices 6 and 7, an inward movement of transmembrane helix 1, reorganization of extracellular loop 2 and outward movement of the intracellular side of transmembrane helix 6, resulting in G-protein interaction and activation2-6. Here we solved the structure of a non-peptide agonist, TT-OAD2, bound to the glucagon-like peptide-1 (GLP-1) receptor. Our structure identified an unpredicted non-peptide agonist-binding pocket in which reorganization of extracellular loop 3 and transmembrane helices 6 and 7 manifests independently of direct ligand interaction within the deep transmembrane domain pocket. TT-OAD2 exhibits biased agonism, and kinetics of G-protein activation and signalling that are distinct from peptide agonists. Within the structure, TT-OAD2 protrudes beyond the receptor core to interact with the lipid or detergent, providing an explanation for the distinct activation kinetics that may contribute to the clinical efficacy of this compound series. This work alters our understanding of the events that drive the activation of class B receptors.[1] |
Solubility Data
| Solubility (In Vitro) | May dissolve in DMSO (in most cases), if not, try other solvents such as H2O, Ethanol, or DMF with a minute amount of products to avoid loss of samples |
| Solubility (In Vivo) |
Note: Listed below are some common formulations that may be used to formulate products with low water solubility (e.g. < 1 mg/mL), you may test these formulations using a minute amount of products to avoid loss of samples. Injection Formulations (e.g. IP/IV/IM/SC) Injection Formulation 1: DMSO : Tween 80: Saline = 10 : 5 : 85 (i.e. 100 μL DMSO stock solution → 50 μL Tween 80 → 850 μL Saline) *Preparation of saline: Dissolve 0.9 g of sodium chloride in 100 mL ddH ₂ O to obtain a clear solution. Injection Formulation 2: DMSO : PEG300 :Tween 80 : Saline = 10 : 40 : 5 : 45 (i.e. 100 μL DMSO → 400 μLPEG300 → 50 μL Tween 80 → 450 μL Saline) Injection Formulation 3: DMSO : Corn oil = 10 : 90 (i.e. 100 μL DMSO → 900 μL Corn oil) Example: Take the Injection Formulation 3 (DMSO : Corn oil = 10 : 90) as an example, if 1 mL of 2.5 mg/mL working solution is to be prepared, you can take 100 μL 25 mg/mL DMSO stock solution and add to 900 μL corn oil, mix well to obtain a clear or suspension solution (2.5 mg/mL, ready for use in animals). Injection Formulation 4: DMSO : 20% SBE-β-CD in saline = 10 : 90 [i.e. 100 μL DMSO → 900 μL (20% SBE-β-CD in saline)] *Preparation of 20% SBE-β-CD in Saline (4°C,1 week): Dissolve 2 g SBE-β-CD in 10 mL saline to obtain a clear solution. Injection Formulation 5: 2-Hydroxypropyl-β-cyclodextrin : Saline = 50 : 50 (i.e. 500 μL 2-Hydroxypropyl-β-cyclodextrin → 500 μL Saline) Injection Formulation 6: DMSO : PEG300 : castor oil : Saline = 5 : 10 : 20 : 65 (i.e. 50 μL DMSO → 100 μLPEG300 → 200 μL castor oil → 650 μL Saline) Injection Formulation 7: Ethanol : Cremophor : Saline = 10: 10 : 80 (i.e. 100 μL Ethanol → 100 μL Cremophor → 800 μL Saline) Injection Formulation 8: Dissolve in Cremophor/Ethanol (50 : 50), then diluted by Saline Injection Formulation 9: EtOH : Corn oil = 10 : 90 (i.e. 100 μL EtOH → 900 μL Corn oil) Injection Formulation 10: EtOH : PEG300:Tween 80 : Saline = 10 : 40 : 5 : 45 (i.e. 100 μL EtOH → 400 μLPEG300 → 50 μL Tween 80 → 450 μL Saline) Oral Formulations Oral Formulation 1: Suspend in 0.5% CMC Na (carboxymethylcellulose sodium) Oral Formulation 2: Suspend in 0.5% Carboxymethyl cellulose Example: Take the Oral Formulation 1 (Suspend in 0.5% CMC Na) as an example, if 100 mL of 2.5 mg/mL working solution is to be prepared, you can first prepare 0.5% CMC Na solution by measuring 0.5 g CMC Na and dissolve it in 100 mL ddH2O to obtain a clear solution; then add 250 mg of the product to 100 mL 0.5% CMC Na solution, to make the suspension solution (2.5 mg/mL, ready for use in animals). Oral Formulation 3: Dissolved in PEG400 Oral Formulation 4: Suspend in 0.2% Carboxymethyl cellulose Oral Formulation 5: Dissolve in 0.25% Tween 80 and 0.5% Carboxymethyl cellulose Oral Formulation 6: Mixing with food powders Note: Please be aware that the above formulations are for reference only. InvivoChem strongly recommends customers to read literature methods/protocols carefully before determining which formulation you should use for in vivo studies, as different compounds have different solubility properties and have to be formulated differently. (Please use freshly prepared in vivo formulations for optimal results.) |
| Preparing Stock Solutions | 1 mg | 5 mg | 10 mg | |
| 1 mM | 1.1671 mL | 5.8355 mL | 11.6709 mL | |
| 5 mM | 0.2334 mL | 1.1671 mL | 2.3342 mL | |
| 10 mM | 0.1167 mL | 0.5835 mL | 1.1671 mL |