PIK-75 is a p110α inhibitor with IC50 of 5.8 nM, which is 200-fold more potent than p110β. Additionally, in cell-free assays, it significantly inhibits DNA-PK, with an IC50 of 2 nM. In a variety of cell types, PIK-75, which was created as part of a PI 3-kinase drug discovery program, can attenuate insulin stimulation of Akt/PKB at a concentration of 100 nM. With an IC50 value in the range of 50 nM, PIK-75 has been shown to inhibit the growth of several different cell lines. PIK-75 inhibited the growth of HeLa cell xenografts in mice models when given at a dose of 50 mg/kg, according to in vivo studies. When PIK-75 attacked the p110 isoform of PI3K in acute myeloid leukemia cells, the connection between Bcl-xL and Bak was broken.
Physicochemical Properties
| Molecular Formula | C16H14BRN5O4S |
| Molecular Weight | 452.28 |
| Exact Mass | 450.994 |
| Elemental Analysis | C, 42.49; H, 3.12; Br, 17.67; N, 15.48; O, 14.15; S, 7.09 |
| CAS # | 372196-67-3 |
| Related CAS # | PIK-75 hydrochloride;372196-77-5 |
| PubChem CID | 10275789 |
| Appearance | Light brown to brown solid powder |
| Density | 1.7±0.1 g/cm3 |
| Index of Refraction | 1.701 |
| LogP | 3.84 |
| Hydrogen Bond Donor Count | 0 |
| Hydrogen Bond Acceptor Count | 7 |
| Rotatable Bond Count | 4 |
| Heavy Atom Count | 27 |
| Complexity | 679 |
| Defined Atom Stereocenter Count | 0 |
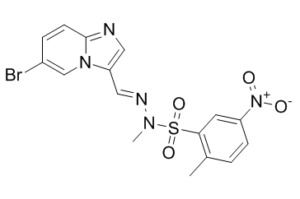
| SMILES | BrC1=CN2C(/C=N/N(C)S(C3C=C([N+]([O-])=O)C=CC=3C)(=O)=O)=CN=C2C=C1 |
| InChi Key | QTHCAAFKVUWAFI-DJKKODMXSA-N |
| InChi Code | InChI=1S/C16H14BrN5O4S/c1-11-3-5-13(22(23)24)7-15(11)27(25,26)20(2)19-9-14-8-18-16-6-4-12(17)10-21(14)16/h3-10H,1-2H3/b19-9+ |
| Chemical Name | N-[(E)-(6-bromoimidazo[1,2-a]pyridin-3-yl)methylideneamino]-N,2-dimethyl-5-nitrobenzenesulfonamide |
| Synonyms | PIK 75; PIK75; PIK-75; 372196-67-3; 945619-31-8; UNII-9058I8S63D; (E)-N'-((6-bromoimidazo[1,2-a]pyridin-3-yl)methylene)-N,2-dimethyl-5-nitrobenzenesulfonohydrazide; 9058I8S63D; PIK-75 |
| HS Tariff Code | 2934.99.9001 |
| Storage |
Powder-20°C 3 years 4°C 2 years In solvent -80°C 6 months -20°C 1 month |
| Shipping Condition | Room temperature (This product is stable at ambient temperature for a few days during ordinary shipping and time spent in Customs) |
Biological Activity
| Targets |
DNA-PK (IC50 = 2 nM); p110α (IC50 = 5.8 nM); p110γ (IC50 = 76 nM); p110δ (IC50 = 510 nM); p110β (IC50 = 1.3 μM); hsVPS34 (IC50 = 2.6 μM); PI3KC2β (IC50 = 1 μM); PI3KC2α (IC50 = 10 μM); mTORC1 (IC50 = 1 μM); mTORC2 (IC50 = 10 μM); ATM (IC50 = 2.3 μM); ATR (IC50 = 21 μM); PI4KIIIβ (IC50 = 50 μM)
Class I PI3-K isoform p110α: The IC₅₀ value against p110α is less than 5 μM. When tested in vitro in the presence of 10 μM ATP, it can inhibit purified p110α, and the inhibition effect is reflected in the reduction of PI3-K activity associated with IRS-1 immunoprecipitates [1] - NRF2: It can reduce the protein level and activity of NRF2, and regulate the expression of NRF2 target genes through proteasome-mediated degradation of NRF2 [3] |
| ln Vitro |
PIK-75 also inhibits p110δ, PI3KC2β, mTORC1, ATM, hsVPS34, PI3KC2α, mTORC2, ATR and PI4KIIIβ with IC50s of 510 nM, ~1 μM, ~1 μM, 2.3 μM, 2.6 μM, ~10 μM, ~10 μM, 21 μM, ~50 μM, respectively[1]. With an IC50 of 1.2 M in L6 myotubes and 1.3 M in 3T3-L1 adipocytes, respectively, PIK-75 alone inhibits the phosphorylation of Thr 308[1]. With an IC50 value of 78 nM, PIK-75 (1–1000 nM; 5 min) inhibits the insulin-induced phosphorylation of PKB on Ser473 and Thr308 in CHO-IR cells in a dose-dependent manner. Through inducing apoptosis in pancreatic cancer cells, PIK-75 (0.1-1000 nM; 48 hours) prevents their growth and survival[3]. In addition, pancreatic cancer MIA PaCa-2 and AsPC-1 cells form fewer colonies when PIK-75 (0.1–1000 nM) is present[3]. 1. Inhibition of PI3-K activity and insulin signaling: In 3T3-L1 adipocytes and L6 myotubes, PIK-75 (0.05 μM) can inhibit insulin-stimulated PI3-K activity associated with IRS-1 immunoprecipitates. It also reduces insulin-induced phosphorylation of downstream molecules such as Akt (Thr 308), ERK1/2 (p202/204), GSK3α/β (p21/9), rpS6 (p235/236), and 4E-BP1 (p37/46) in these cells. Additionally, it decreases insulin-stimulated inositol lipid levels and inhibits insulin-induced glucose transport of ³H-2-deoxyglucose into adipocytes [1] 2. Effect on different cell lines' insulin signaling: In CHO-IR cells, 3T3-L1 fibroblasts, and 3T3-L1 adipocytes, PIK-75 (100 nM) inhibits insulin-induced phosphorylation of PKB (Ser ⁴⁷³ and Thr ³⁰⁸) in a dose-dependent manner. In HepG2 hepatoma cells, inhibition of p110α alone by PIK-75 is not sufficient to block insulin signaling to PKB, but when combined with p110β or p110δ inhibitors, it significantly attenuates insulin signaling. In J774.2 macrophage cells, PIK-75 (50 nM) inhibits insulin signaling to PKB to a similar extent as inhibitors of p110β or p110δ [2] 3. Inhibition of NRF2 and effect on pancreatic cancer cells: In human pancreatic cancer cell lines (AsPC-1 and MIA PaCa-2), PIK-75 (0.1 μM) reduces NRF2 transcriptional activity, as shown by the decrease in luciferase activity of the NRF2 reporter gene ARE-Luc. It also lowers the mRNA levels of NRF2 target genes such as HO-1 and MRP5. Western blot analysis reveals that PIK-75 decreases NRF2 protein levels in a dose-dependent manner. Moreover, PIK-75 inhibits the proliferation and survival of pancreatic cancer cells through apoptotic cell death. MTT assay shows that after 48 hours of treatment with increasing concentrations of PIK-75, the viability of MIA PaCa-2 and AsPC-1 cells decreases. Crystal violet staining indicates a reduction in the survival fraction. Western blot analysis detects the activation of apoptotic markers. When combined with gemcitabine, PIK-75 augments gemcitabine-induced cytotoxicity, reduces gemcitabine-induced NRF2 levels and MRP5 expression, enhances gemcitabine-induced apoptotic cell death (as shown by increased caspase-3/7 activity and apoptotic marker expression), and reduces the viability of pancreatic cancer cells [3] |
| ln Vivo |
PIK-75 (2 mg/kg) potentiates anticancer activity of Gemcitabine (20 mg/kg) in vivo. Gemcitabine (20 mg/kg) or PIK-75 (2 mg/kg) alone both significantly slow tumor growth. The combination of PIK-75 and Gemcitabine clearly has a positive effect because it significantly slows the growth of tumors in vivo while having no negative effects on the body weights of mice[3]. PIK-75 potentiates anticancer activity of gemcitabine in vivo [3] The effect of PIK-75/gemcitabine combination was further demonstrated by in vivo mouse xenograft model. Mice bearing tumors of MIA PaCa-2 were administered with gemcitabine (20 mg/kg), PIK-75 (2 mg/kg), or combination of both drugs. Since PIK-75 is a reversible inhibitor, PIK-75 was administered 5 times per week to ensure maintaining sufficient inhibitory effects. Gemcitabine was administered twice per week. As shown in Fig. 7A, gemcitabine or PIK-75 reduced the tumor growth to similar degree. Beneficial effect of PIK-75/gemcitabine was evident as this combination markedly reduced the tumor growth in vivo without affecting the body weights of mice (Fig. 7B). 1. Effect on insulin tolerance in mice: PIK-75 blocks the acute effects of insulin treatment in vivo. In insulin tolerance tests, compared with the insulin plus drug vehicle group, the group treated with insulin plus PIK-75 shows altered blood glucose levels, indicating that PIK-75 inhibits insulin's effect on glucose metabolism [1] 2. Antitumor effect in xenograft model: In a xenograft model of MIA PaCa-2 pancreatic cancer in mice, co-treatment with PIK-75 and gemcitabine enhances the antitumor effect of gemcitabine. Measurement of tumor sizes shows that the tumor growth in the combination group is significantly slower than that in the gemcitabine alone group or the PIK-75 alone group. The body weights of mice in each group are measured, and no significant abnormal changes are found in the combination group compared with the control group, suggesting good tolerability [3] |
| Enzyme Assay |
The PI3K inhibitor PIK-75 is dissolved at 10 mM in dimethyl sulfoxide and stored at −20°C until use. PI3K enzyme activity is determined in 50 μL of 20 mM HEPES, pH 7.5, and 5 mM MgCl2 containing 180 μM phosphatidyl inositol, with the reaction started by the addition of 100 μM ATP (containing 2.5 μCi of [γ-32P]ATP). After a 30-minute incubation at room temperature, the enzyme reaction is stopped by the addition of 50 μL of 1 M HCl. Phospholipids are then extracted with 100 μL of chloroform/methanol [1:1 (v/v)] and 250 μL of 2 M KCl followed by liquid scintillation counting. Inhibitors are diluted in 20% (v/v) dimethyl sulfoxide to generate a concentration versus inhibition of enzyme activity curve, which is then analyzed with the use of Prism version 5.00 for Windows to calculate the IC50. For kinetic analysis, a luminescent assay measuring ATP consumption is used. PI3K enzyme activity is determined in 50 μL of 20 mM HEPES, pH 7.5, and 5 mM MgCl2 with PI and ATP at various concentrations. After a 60-minute incubation at room temperature, the reaction is stopped by the addition of 50 μL of Kinase-Glo followed by a further 15-minute incubation. Luminescence is then read using a Fluostar plate reader. Results are analyzed using Prism. 1. PI3-K activity assay: Purified class I PI3-Ks are incubated with different concentrations of PIK-75 in the presence of 10 μM ATP. The reaction mixture is then processed to measure PI3-K activity. The activity is determined by detecting the production of phosphatidylinositol 3-phosphate (PI3P) or other downstream products. The inhibition rate of PIK-75 on PI3-K activity is calculated by comparing with the activity in the presence of DMSO (control). This assay is used to evaluate the inhibitory effect of PIK-75 on purified p110α, p110β, and other class I PI3-K isoforms [1] 2. NRF2 transcriptional activity assay: AsPC-1 or MIA PaCa-2 cells are transfected with the NRF2 reporter gene ARE-Luc and (if needed) pCDNA3 or FLAG-NRF2. After transfection, the cells are treated with PIK-75 (0.1 μM or other concentrations) for a certain period (20 h or 8 h). Then, the cells are lysed, and luciferase activity is measured using a luciferase assay kit. The relative luciferase activity is calculated by comparing with the control group (without PIK-75 treatment) to evaluate the effect of PIK-75 on NRF2 transcriptional activity [3] 3. DNA-binding activity assay of NRF2: Nuclear extracts are prepared from AsPC-1 cells transfected with pCDNA3 or FLAG-NRF2 and treated with different concentrations of PIK-75 for 24 h. The DNA-binding activity of NRF2 in the nuclear extracts is detected using a specific assay kit (e.g., EMSA kit). The binding of NRF2 to its specific DNA sequence (ARE) is analyzed, and the relative binding activity is compared with the control group to determine the effect of PIK-75 on NRF2 DNA-binding activity [3] |
| Cell Assay |
Mitochondrial activity is assessed after stimulation with TGFβ with or without inhibitors for 48 hours using the 3-(4,5-dimethylthiazol-2-yl)-2,5-diphenyltetrazolium (MTT) assay. Harvested washed cells are resuspended in DMEM-lO% FCS and aliquoted (500 μL) into 24-well cluster plates prior to serial dilution (1:2) in duplicates. To each well, 100 μL of an appropriate MTT concentration (dissolved in PBS and filtered through a 0.2 μm filter before use to remove any blue formazan product) is added immediately after diluting the cells, which are then incubated for 3.5 hours at 37 °C. The resulting blue formazan product is solubilized overnight (16 hours) at 37 °C by the addition of 500 μL of 10% sodium dodecyl sulfate (SDS) in 0.01 M HCl to each well. A sample (150 μL) from each duplicate well is transferred to a 96-well microplate, and the optical density determinedby automated spectrophotometry against a reagent blank (no cells). Absorbance is measured at a test wavelength of 570 nm and a reference wavelength of 690 nm. For each primary cell culture, results from three to six wells from each treatment are averaged, and data are expressed as absorbance 570 to 690 nm. Cells: A2780, A2780/cp70, 2780AD, HCT116, HT29, WIL, CALU-3, MCF7, PC3 and HS852 cells. 1. Western blot analysis for insulin signaling: 3T3-L1 adipocytes, L6 myotubes, CHO-IR cells, 3T3-L1 fibroblasts, HepG2 cells, or J774.2 cells are starved overnight. Then, the cells are incubated with PIK-75 (different concentrations such as 0.05 μM, 50 nM, 100 nM) or DMSO for 5 min, followed by stimulation with insulin (1 nM, 100 nM) for 10 min. The cells are lysed, and the lysates are subjected to SDS-PAGE. After electrophoresis, the proteins are transferred to a membrane, which is then incubated with primary antibodies specific to phosphorylated proteins (e.g., p-Akt Thr 308, p-PKB Ser ⁴⁷³, p-PKB Thr ³⁰⁸) and corresponding total proteins. After washing, the membrane is incubated with secondary antibodies, and the bands are detected using a chemiluminescence kit. The intensity of the bands is quantified to analyze the effect of PIK-75 on insulin signaling [1][2] 2. Glucose transport assay in adipocytes: 3T3-L1 adipocytes are starved and treated with PIK-75 or other reagents. Then, insulin is added to stimulate glucose transport. ³H-2-deoxyglucose is added to the cells, and after a certain period of incubation, the cells are washed to remove unincorporated ³H-2-deoxyglucose. The radioactivity in the cells is measured using a scintillation counter to determine the amount of glucose transported into the cells, thereby evaluating the effect of PIK-75 on insulin-stimulated glucose transport [1] 3. Cell viability assay (MTT assay): MIA PaCa-2 and AsPC-1 pancreatic cancer cells are seeded in 96-well plates. After attachment, the cells are treated with increasing concentrations of PIK-75 alone or in combination with gemcitabine for 48 h. Then, MTT solution is added to each well, and the plates are incubated for a certain time. The formazan crystals formed are dissolved, and the absorbance at a specific wavelength is measured using a microplate reader. The cell viability is calculated based on the absorbance values, and the effect of PIK-75 on cell viability is analyzed [3] 4. siRNA transfection and related assays: AsPC-1 cells are transfected with NRF2 siRNA or control siRNA using a transfection reagent. After transfection, the cells are treated with gemcitabine for 48 h, and cell viability is determined by trypan blue assay or MTT assay. Additionally, cell lysates from transfected cells are analyzed by western blot to detect NRF2 protein levels, and total RNA is extracted to prepare cDNA for RT-PCR or qRT-PCR to detect the mRNA levels of NRF2 and its target genes [3] 5. Caspase-3/7 activity assay: MIA PaCa-2 cells are treated with PIK-75, gemcitabine, or their combination for 12 h. Then, the cells are lysed, and the caspase-3/7 activity in the lysates is measured using a caspase activity assay kit. The fluorescence intensity is detected, and the relative caspase-3/7 activity is calculated to evaluate the effect of PIK-75 on gemcitabine-induced apoptotic cell death [3] |
| Animal Protocol |
Dissolved in DMSO and then diluted in PBS.; ≤1 μM; i.p. RAMTLn3 cells are injected into the right fourth mammary fat pad from the head of female severe-combined immunodeficient/NCr mice. Tumor xenograft study [3] MIA PaCa-2 cells (∼1.7×10⁶ cells/mouse) mixed with Matrigel were injected subcutaneously into the flank of male athymic nude (Foxn1nu) mice aged 6-weeks. Gemcitabine (50 mg/ml) was dissolved in PBS and PIK-75 (20 mg/ml) was dissolved in DMSO. Injection solution was made as 10% of Cremophor® EL and 3% of poly(ethylene glycol) 400 in sterile water. Before administration of compounds, gemcitabine was further diluted in PBS and DMSO or PIK-75 was further diluted in the injection solution and sterilized by 0.2 μm filter unit. These diluents were mixed with 1:1 ratio and administered into peritoneal cavity of the mouse. Gemcitabine (20 mg/kg) or gemcitabine (20 mg/kg)/PIK-75 (2 mg/kg) combination was administered twice per week and vehicle control and PIK-75 (2 mg/kg) were administered 5 times per week. The body weights and tumor sizes were measured 3 times per week. Tumor volumes were calculated as width (mm) × length (mm) × height (mm)/2. 1. Insulin tolerance test in mice: Mice are divided into different groups, including insulin plus drug vehicle group, insulin plus PIK-75 group, drug plus insulin vehicle group, and insulin vehicle plus drug vehicle group. PIK-75 is administered to the mice (the specific administration route is not specified in the literature) before insulin injection. Then, insulin is injected, and blood glucose levels are measured at different time points after insulin injection to evaluate the effect of PIK-75 on insulin tolerance [1] 2. Pancreatic cancer xenograft model in mice: Mice are subcutaneously inoculated with MIA PaCa-2 pancreatic cancer cells to establish xenograft tumors. When the tumors reach a certain size, the mice are randomly divided into groups, including control group, PIK-75 alone group, gemcitabine alone group, and PIK-75 plus gemcitabine combination group. PIK-75 and gemcitabine are administered according to a specific schedule (the specific administration frequency and route are not detailed in the literature). Tumor sizes and mouse body weights are measured three times a week. Tumor volume is calculated based on the measured tumor dimensions to evaluate the antitumor effect of PIK-75 in combination with gemcitabine [3] |
| References |
[1]. A pharmacological map of the PI3-K family defines a role for p110alpha in insulin signaling. Cell. 2006 May 19;125(4):733-47. [2]. Evidence for functional redundancy of class IA PI3K isoforms in insulin signalling. Biochem J. 2007 Jun 15;404(3):449-58. [3]. Inhibition of NRF2 by PIK-75 augments sensitivity of pancreatic cancer cells to gemcitabine. Int J Oncol. 2014 Mar;44(3):959-69. |
| Additional Infomation |
N-[(6-bromo-3-imidazo[1,2-a]pyridinyl)methylideneamino]-N,2-dimethyl-5-nitrobenzenesulfonamide is a sulfonamide. PIK-75 is a preferential p110 alpha/gamma PI3K inhibitor. Phosphoinositide 3-kinases (PI3-Ks) are an important emerging class of drug targets, but the unique roles of PI3-K isoforms remain poorly defined. We describe here an approach to pharmacologically interrogate the PI3-K family. A chemically diverse panel of PI3-K inhibitors was synthesized, and their target selectivity was biochemically enumerated, revealing cryptic homologies across targets and chemotypes. Crystal structures of three inhibitors bound to p110gamma identify a conformationally mobile region that is uniquely exploited by selective compounds. This chemical array was then used to define the PI3-K isoforms required for insulin signaling. We find that p110alpha is the primary insulin-responsive PI3-K in cultured cells, whereas p110beta is dispensable but sets a phenotypic threshold for p110alpha activity. Compounds targeting p110alpha block the acute effects of insulin treatment in vivo, whereas a p110beta inhibitor has no effect. These results illustrate systematic target validation using a matrix of inhibitors that span a protein family.[1] Recent genetic knock-in and pharmacological approaches have suggested that, of class IA PI3Ks (phosphatidylinositol 3-kinases), it is the p110alpha isoform (PIK3CA) that plays the predominant role in insulin signalling. We have used isoform-selective inhibitors of class IA PI3K to dissect further the roles of individual p110 isoforms in insulin signalling. These include a p110alpha-specific inhibitor (PIK-75), a p110alpha-selective inhibitor (PI-103), a p110beta-specific inhibitor (TGX-221) and a p110delta-specific inhibitor (IC87114). Although we find that p110alpha is necessary for insulin-stimulated phosphorylation of PKB (protein kinase B) in several cell lines, we find that this is not the case in HepG2 hepatoma cells. Inhibition of p110beta or p110delta alone was also not sufficient to block insulin signalling to PKB in these cells, but, when added in combination with p110alpha inhibitors, they are able to significantly attenuate insulin signalling. Surprisingly, in J774.2 macrophage cells, insulin signalling to PKB was inhibited to a similar extent by inhibitors of p110alpha, p110beta or p110delta. These results provide evidence that p110beta and p110delta can play a role in insulin signalling and also provide the first evidence that there can be functional redundancy between p110 isoforms. Further, our results indicate that the degree of functional redundancy is linked to the relative levels of expression of each isoform in the target cells.[2] We describe the potential benefit of PIK-75 in combination of gemcitabine to treat pancreatic cancer in a preclinical mouse model. The effect of PIK-75 on the level and activity of NRF2 was characterized using various assays including reporter gene, quantitative PCR, DNA-binding and western blot analyses. Additionally, the combinatorial effect of PIK-75 and gemcitabine was evaluated in human pancreatic cancer cell lines and a xenograft model. PIK-75 reduced NRF2 protein levels and activity to regulate its target gene expression through proteasome-mediated degradation of NRF2 in human pancreatic cancer cell lines. PIK-75 also reduced the gemcitabine-induced NRF2 levels and the expression of its downstream target MRP5. Co-treatment of PIK-75 augmented the antitumor effect of gemcitabine both in vitro and in vivo. Our present study provides a strong mechanistic rationale to evaluate NRF2 targeting agents in combination with gemcitabine to treat pancreatic cancers.[3] 1. Role in PI3-K family research: PIK-75 is part of a chemically diverse panel of PI3-K inhibitors used to pharmacologically interrogate the PI3-K family. It helps define the unique roles of PI3-K isoforms, especially the role of p110α in insulin signaling. The use of PIK-75 and other isoform-selective inhibitors illustrates a systematic target validation approach using a matrix of inhibitors spanning a protein family [1] 2. Functional redundancy of PI3-K isoforms: In the study of insulin signaling, PIK-75 is used to explore the functional redundancy of class IA PI3K isoforms. The results show that the degree of functional redundancy is related to the relative expression levels of each isoform in target cells. For example, in HepG2 cells and J774.2 cells, PIK-75 alone cannot fully block insulin signaling, indicating that other isoforms (p110β, p110δ) can compensate for the function of p110α [2] 3. Mechanism of enhancing gemcitabine sensitivity: PIK-75 enhances the sensitivity of pancreatic cancer cells to gemcitabine by inhibiting NRF2. It induces proteasome-mediated degradation of NRF2, thereby reducing NRF2 protein levels and activity, down-regulating the expression of NRF2 target genes (such as MRP5), and ultimately enhancing the antitumor effect of gemcitabine. This provides a mechanistic basis for evaluating NRF2-targeting agents in combination with gemcitabine for the treatment of pancreatic cancer [3] |
Solubility Data
| Solubility (In Vitro) |
|
|||
| Solubility (In Vivo) |
|
| Preparing Stock Solutions | 1 mg | 5 mg | 10 mg | |
| 1 mM | 2.2110 mL | 11.0551 mL | 22.1102 mL | |
| 5 mM | 0.4422 mL | 2.2110 mL | 4.4220 mL | |
| 10 mM | 0.2211 mL | 1.1055 mL | 2.2110 mL |