MQAE (N-[ethoxycarbonylmethyl]-6-methoxy-quinolinium bromide) is an analog of 6-methoxyquinolinium. It is a novel fluorescent indicator/dye for detection of intracellular Cl-. MQAE detects the ion when quenched via collision with chloride. It is more frequently used for chloride measurement as it is more sensitive and selective than 36Cl and microelectrode-based methods. MQAE is a useful fluorescence dye for noninvasive measurements of the intracellular Cl-.
Physicochemical Properties
| Molecular Formula | C14H16BRNO3 | |
| Molecular Weight | 326.19 | |
| Exact Mass | 325.031 | |
| Elemental Analysis | C, 51.55; H, 4.94; Br, 24.50; N, 4.29; O, 14.71 | |
| CAS # | 162558-52-3 | |
| Related CAS # |
|
|
| PubChem CID | 2762651 | |
| Appearance | Light yellow to khaki solid powder | |
| Melting Point | 177-179ºC(lit.) | |
| Hydrogen Bond Donor Count | 0 | |
| Hydrogen Bond Acceptor Count | 4 | |
| Rotatable Bond Count | 5 | |
| Heavy Atom Count | 19 | |
| Complexity | 282 | |
| Defined Atom Stereocenter Count | 0 | |
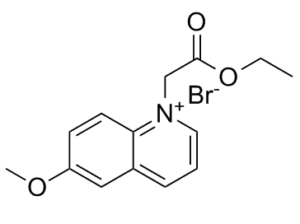
| SMILES | CCOC(=O)C[N+]1=CC=CC2=C1C=CC(=C2)OC.[Br-] |
|
| InChi Key | DSLLHVISNOIYHR-UHFFFAOYSA-M | |
| InChi Code | InChI=1S/C14H16NO3.BrH/c1-3-18-14(16)10-15-8-4-5-11-9-12(17-2)6-7-13(11)15;/h4-9H,3,10H2,1-2H3;1H/q+1;/p-1 | |
| Chemical Name |
|
|
| Synonyms |
|
|
| HS Tariff Code | 2934.99.9001 | |
| Storage |
Powder-20°C 3 years 4°C 2 years In solvent -80°C 6 months -20°C 1 month Note: Please store this product in a sealed and protected environment (e.g. under nitrogen), avoid exposure to moisture and light. |
|
| Shipping Condition | Room temperature (This product is stable at ambient temperature for a few days during ordinary shipping and time spent in Customs) |
Biological Activity
| Targets |
Fluorescent dye for monitoring glucose uptake in living cells and tissues Intracellular chloride ions ([Cl⁻]i) (no traditional "target" like enzyme/receptor; binds [Cl⁻]i via electrostatic interaction for quantitative fluorescence detection). - Dissociation constant (Kd) for [Cl⁻]i: ~140 mM (determined by fluorescence titration in vitro, consistent with physiological [Cl⁻]i range (10-60 mM))[3] |
| ln Vitro |
Perform MQAE staining either in vitro (Steps 1–2) or in vivo (Steps 3–7), then proceed to imaging (Step 8). Staining Cells in Culture or Tissue Slices via Bath Application of MQAE This protocol allows high-quality staining of the upper 70–120 µm of a slice so that different types of neurons can be identified based on their morphology (Marandi et al. 2002; see also Fig. 1). 1. Dissolve MQAE in standard external saline for mouse to a final concentration of 6 mM. 2. Incubate cultured cells or brain slices with this solution for 10 min at 37°C, and then rinse them with dye-free saline for 10–15 min. 1. Two-photon [Cl⁻]i imaging in neurons and HEK293 cells (Literature [1]): - Primary mouse hippocampal neurons (P0-P2 pups, cultured 7-10 days): Loaded with MQAE (5-10 mM, 37℃ for 30 minutes). Two-photon microscopy (excitation 720 nm, emission 460±20 nm) showed fluorescence intensity decreased by ~40% when [Cl⁻]i increased from 10 mM to 40 mM; no cross-reactivity with Na⁺, K⁺, Ca²⁺ (physiological concentrations). - HEK293 cells: 10 mM MQAE stably reported [Cl⁻]i changes for >2 hours, with fluorescence signal variation <5% (no photobleaching-related artifacts)[1] 2. Chloride efflux detection in renal epithelial cells (Literature [2]): - Rat renal proximal tubule epithelial cells (cultured in DMEM/F12 + 10% FBS): Loaded with MQAE (5 mM, 37℃ for 45 minutes). Furosemide (10 μM, chloride efflux inducer) treatment increased MQAE fluorescence by ~35% within 15 minutes (vs. baseline), consistent with X-ray microanalysis results (chloride content decreased by ~32%), confirming reliable [Cl⁻]i quantification[2] 3. [Cl⁻]i measurement in vascular smooth muscle cells (Literature [3]): - Cultured rat aortic smooth muscle cells: Loaded with MQAE (5 mM, 37℃ for 60 minutes in HBS pH 7.4). Norepinephrine (1 μM) increased [Cl⁻]i from ~35 mM to ~55 mM, accompanied by a ~30% decrease in MQAE fluorescence. Cell viability remained >90% (trypan blue exclusion) after 2-hour loading[3] 4. Volume-independent [Cl⁻]i measurement in airway cells (Literature [4]): - Mouse airway ciliary cells (isolated from trachea): Loaded with MQAE (5 mM, 37℃ for 30 minutes in HBS + 25 mM mannitol). Two-photon microscopy (excitation 730 nm, emission 460 nm) showed MQAE fluorescence accurately reflected [Cl⁻]i even when cell volume changed by ±15% (osmotic shock), with correlation coefficient R²=0.92 vs. chloride electrode data. Ciliary beating frequency remained unchanged (~12 Hz vs. control ~11.8 Hz)[4] [1][2][3][4] |
| ln Vivo |
In Vivo Staining of Neurons and Glia Using Multicell Bolus Loading[1] \nThis method allows staining of both neurons and glia cells (see Fig. 2) within a spherical volume with a diameter of ∼200 µm. \n\n3. Conduct surgery on mouse brain as described in In Vivo Two-Photon Calcium Imaging Using Multicell Bolus Loading (Garaschuk and Konnerth 2010). \n\n4. Filter freshly prepared pipette staining solution, using an Ultrafree-MC centrifugal filter. \n\n5. Fill a pipette similar to a patch pipette with the staining solution (the resistance of the filled pipette is 3–6 MΩ), and position it under optical control at the desired depth within the brain tissue using an LN-Mini manipulator. Use the imaging system to continuously monitor the position of the pipette. \n\n6. Pressure-eject MQAE into the brain using a brief (only 500 msec) ejection pulse (ejection pressure 34.5 kPa). Repeat the ejection two to four times at an interpulse interval of 1–3 min. \n\n7. Inspect the quality of the obtained staining ∼10 min after the last ejection pulse. \n\nThis short waiting time is necessary to allow wash-out of the MQAE from the extracellular space (most probably because of microcirculation). In contrast to membrane–permeant calcium indicator dyes, MQAE is not undergoing deesterification inside the cells; and, therefore, no additional waiting time is required. \n\nTwo-Photon Imaging of Cells Stained with MQAE \n8. Perform two-photon imaging. \n\nWith one-photon excitation, MQAE is excited at wavelengths of 320–400 nm and has an emission maximum at 460 nm (Verkman et al. 1989). With two-photon imaging, MQAE is excited efficiently at ∼740–770 nm. It is also possible to excite MQAE at longer wavelengths (up to 800 nm), but the intensity of the emitted light is lower (Marandi et al. 2002). Using our imaging system, it was not possible to excite MQAE at excitation wavelengths of 960–990 nm. \n\nIntracellular Calibration of MQAE \nThe efficiency of quenching of quinolinium-based Cl– indicators by Cl– depends on the viscosity and/or the polarity of the solvent (Jayaraman and Verkman 2000) and may, therefore, be different inside cells compared with in the cuvette tests. The calibration protocol introduced by Krapf et al. may be used for calibration of Cl– levels in neurons in slices (Krapf et al. 1988; Marandi et al. 2002). \n\n9. Prepare in vitro calibration solutions containing different amounts of Cl− (e.g., 0, 10, 20, 30, and 40 mM). Add tributyltin chloride (10 µM) and nigericin (10 µM) to each of these solutions. \n\nThis treatment will breakdown the Cl– gradient across the cell membrane and will ascertain that the cytosolic Cl– concentration ([Cl–]i) is equal to that of the corresponding calibration solution. \n\n10. Apply the in vitro calibration solutions sequentially and measure the intracellular steady-state fluorescence levels. The mean fluorescence level in the Cl−-free solution is defined as F0. Plot the F values for each calibration solution as F0/F versus the corresponding [Cl−]i (a so-called Stern–Volmer plot). The slope of the regression line (Stern–Volmer constant KSV) is the reciprocal of an apparent dissociation constant (Kd). \n\nIn our calibration experiments, the Kd of MQAE was 13 mM in the cuvette and 40 mM (KSV = 24.7 M–1) in vitro, inside neurons in brain slices (Marandi et al. 2002). In other tissues, KSV values varied between 3 and 26 M–1 (Lau et al. 1994; Bevensee et al. 1997; Maglova et al. 1998; Eberhardson et al. 2000; Gilbert et al. 2007; Hille et al. 2009).\n \nTROUBLESHOOTING \nProblem (Steps 2 and 7): Poor staining is observed. \n\nSolution: The MQAE staining itself is relatively easy and reliable. It requires, however, a high-quality slice/in vivo preparation. Consider the following: \n\n1. To obtain good-quality in vivo preparations, please follow the suggestions described in In Vivo Two-Photon Calcium Imaging Using Multicell Bolus Loading (Garaschuk and Konnerth 2010). \n\n2. We do not recommend delivering large amounts of MQAE at once. It looks like MQAE is washed out from the extracellular space less effectively than membrane-permeant calcium indicator dyes, and accumulation of a large amount of the dye leads to bleary (low-contrast–high-brightness) staining. 1. Two-photon [Cl⁻]i imaging in mouse hippocampus (Literature [1]): - Animals: Male C57BL/6 mice (8-10 weeks old). - Administration: MQAE dissolved in 0.9% normal saline (50 mg/kg, single intraperitoneal injection, volume 10 μL/g body weight). - Detection: 30 minutes post-injection, mice anesthetized with 1.5% isoflurane (100% O₂); two-photon microscopy (excitation 720 nm, emission 460±20 nm) imaged hippocampal CA1 neurons (via craniotomy). MQAE penetrated neurons, and resting [Cl⁻]i was quantified as ~25±5 mM. No abnormal behavior (ataxia/lethargy) or TUNEL-positive neurons (apoptosis) were observed[1] |
| Cell Assay |
This protocol describes a technique for high-resolution chloride imaging of living cells using a quinoline-based chloride (Cl−) indicator dye, MQAE (N-[6-methoxyquinolyl] acetoethyl ester). Bath-applied to acute brain slices, MQAE provides high-quality labeling of neuronal cells and their processes. In living anesthetized mice, cortical cells are labeled using the multicell bolus loading procedure. In combination with two-photon microscopy, this procedure enables in vivo visualization of cell bodies of neurons and astrocytes as well as some astrocytic processes and allows one to monitor changes in the intracellular chloride concentration in dozens of individual cells.[1] MATERIALS It is essential that you consult the appropriate Material Safety Data Sheets and your institution's Environmental Health and Safety Office for proper handling of equipment and hazardous materials used in this protocol. Reagents In vitro calibration solutions MQAE (Invitrogen) (for in vitro staining) MQAE cuvette calibration solutions Nigericin (a K+/H+ ionophore) Pipette staining solution, freshly prepared (for in vivo staining) Specimen of interest Cultured mouse cells or brain slices (for in vitro staining) Mice of desired strain (for in vivo staining) Standard external saline for mouse (for in vitro staining) Surgical and anesthesia reagents as described in In Vivo Two-Photon Calcium Imaging Using Multicell Bolus Loading (Garaschuk and Konnerth 2010) (for in vivo staining) Tributyltin chloride (a Cl−/OH− antiporter) Equipment Glass capillaries (for in vivo staining) Imaging setup Any commercially available two-photon imaging system can be used. Such systems are available from several providers. We currently use a custom-built setup based on a mode-locked Ti:sapphire laser with automated dispersion compensation and a laser-scanning system coupled to an upright microscope and equipped with a 60×, 1.0-numerical-aperture (NA) water-immersion objective (Fluor 60×; Nikon). Such a custom-built system can be assembled following the instructions described in Majewska et al. (2000) and Nikolenko and Yuste (2005). We excite MQAE at 750–770 nm and collect the fluorescence between 400 and 720 nm. The acquired images are then background corrected and analyzed offline with the ImageJ program (http://rsb.info.nih.gov/ij/) and a LabVIEW-based software package. Incubator, preset to 37°C (for in vitro staining) LN-Mini manipulator (for in vivo staining) Pipette puller (for in vivo staining) Pressure application system (for in vivo staining) Recording chamber with central access opening: custom made from a standard tissue-culture dish (diameter 35 mm; Garaschuk et al. 2006). Surgical and anesthesia equipment as described in In Vivo Two-Photon Calcium Imaging Using Multicell Bolus Loading (Garaschuk and Konnerth 2010) (for in vivo staining) Ultrafree-MC centrifugal filter, pore diameter 0.45 µm (for in vivo staining) 1. Primary hippocampal neuron [Cl⁻]i imaging (Literature [1]): - Cell isolation & culture: Hippocampi dissected from P0-P2 mouse pups, digested with 0.25% trypsin (15 minutes, 37℃), triturated into single cells, and plated on poly-L-lysine-coated coverslips. Cultured in neurobasal medium + B27 supplement (37℃, 5% CO₂) for 7-10 days. - MQAE loading: Medium replaced with HEPES-buffered saline (HBS: 140 mM NaCl, 5 mM KCl, 2 mM CaCl₂, 10 mM HEPES, pH 7.4) containing 5-10 mM MQAE; incubated at 37℃ for 30 minutes. Coverslips washed 3 times with HBS to remove extracellular MQAE. - Imaging & analysis: Two-photon microscope (excitation 720 nm, emission 460±20 nm) captured fluorescence images every 2 minutes. [Cl⁻]i was calculated using a standard curve (prepared with 5-60 mM Cl⁻ in HBS, R²=0.95)[1] 2. Renal epithelial cell chloride efflux assay (Literature [2]): - Cell culture: Rat renal proximal tubule epithelial cells maintained in DMEM/F12 + 10% FBS, passaged to 24-well plates (1×10⁵ cells/well) and cultured overnight. - MQAE loading: Cells washed with PBS, then incubated with 5 mM MQAE in Krebs-Ringer buffer (115 mM NaCl, 5 mM KCl, 2 mM CaCl₂, 1 mM MgSO₄, 25 mM NaHCO₃, 10 mM glucose, pH 7.4) at 37℃ for 45 minutes. - Fluorescence detection: After washing, 10 μM furosemide was added. Fluorescence intensity (excitation 360 nm, emission 460 nm) was measured every 5 minutes for 30 minutes using a microplate reader. Chloride efflux was quantified as the percentage increase in fluorescence vs. baseline[2] 3. Aortic smooth muscle cell [Cl⁻]i measurement (Literature [3]): - Cell isolation & culture: Rat aorta dissected, adventitia removed, and medial layer digested with collagenase (0.1%) for 30 minutes. Smooth muscle cells were plated in DMEM + 10% FBS, cultured to 70% confluency, and seeded in 96-well plates (5×10³ cells/well). - MQAE loading: Cells incubated with 5 mM MQAE in HBS (pH 7.4) at 37℃ for 60 minutes, washed 3 times with HBS to eliminate background. - Analysis: Fluorescence spectrophotometer (excitation 380 nm, emission 460 nm) measured fluorescence. [Cl⁻]i was calculated via the formula: F = F₀ / (1 + Kd/[Cl⁻]i) (F: sample fluorescence, F₀: fluorescence at 0 mM Cl⁻, Kd=140 mM)[3] 4. Airway ciliary cell volume-independent [Cl⁻]i assay (Literature [4]): - Cell isolation: Mouse trachea dissected, epithelial layer detached with protease (0.2%) for 20 minutes, and ciliary cells plated on collagen-coated coverslips (cultured 24 hours). - MQAE loading: Cells incubated with 5 mM MQAE in HBS + 25 mM mannitol (to stabilize osmolarity) at 37℃ for 30 minutes. - Two-photon imaging: After washing, cells were exposed to hypo-osmotic (250 mOsm) or hyper-osmotic (350 mOsm) buffer to induce ±15% volume change. Fluorescence (excitation 730 nm, emission 460 nm) was recorded, and [Cl⁻]i accuracy was verified by correlation with chloride electrode data (R²=0.92)[4] [1][2][3][4] |
| Animal Protocol |
Female mice (C57BL/6J, 5 weeks of age) were fed standard pellet food and water ad libitum. Airway ciliary cells were isolated from the lungs as previously described. Briefly, the mice were anesthetized by 3% isoflurane (inhalation) and then further anesthetized by an intraperitoneal injection (ip) of pentobarbital sodium (40 mg/kg) and heparinized (1000 U/kg) for 15 min. The mice were then sacrificed by a high-dose of pentobarbital sodium (100 mg/kg, ip) and the airway ciliary cells isolated by an elastase treatment.[4] Measurement of MQAE fluorescence intensities [4] MQAE was dissolved in a mixture of acetonitrile and water (1:1; stock solution), and the stock solution (500 mM) was stored at − 20 °C. Isolated airway ciliary cells were incubated with 10 mM MQAE for 60 min at 37 °C. MQAE at 5 mM is widely used for intracellular loading in many cell types, but at this concentration the airway ciliary cells in our study were not sufficiently stained for MQAE within 60 min. We thus used a 10 mM MQAE to obtain sufficient staining to measure the MQAE fluorescence intensity in the airway ciliary cells. The same concentration (10 mM) was used to measure [Cl−]i in A6 cells. The MQAE-loaded cells were set on a coverslip pre-coated with Cell-Tak, which was set in a micro-perfusion chamber (20 µl) mounted on an inverted light microscope equipped with a confocal laser scanning system. MQAE was excited at 780 nm using a two-photon excitation laser system, and emission was at 510 nm. The normalized value of fluorescence intensity (Ft/F0) was calculated; the subscripts “0” or “t” indicate the time just before or just after the start of application of osmotic stress, respectively. The airway ciliary cells were observed in the optical sections (thickness 0.9 μm) using the confocal laser scanning microscope. The cell volume was measured by tracing the outline of a ciliary cell on the phase contrast image of each optical section, and the area (An µm2) was measured; “n” shows the number of optical sections. We also measured the MQAE fluorescence intensity (Fn) in the intracellular area of the cell in each optical section. The image analysis system reported Fn as intensity per micron2. The cell volume (V) was calculated by the sum of An in each section. We also calculated the total MQAE fluorescence intensity of the all cell areas by summing the total fluorescence intensity (An × Fn) in each section. The total MQAE fluorescence intensity in all cell areas indicates [Cl−]i, if the number of MQAE molecules does not change. We obtained 18–22 optical sections from each cell. The normalized value of cell volume (Vt/V0) was also calculated using the sum of An, whereby the subscripts “0” or “t” indicate the time just before or after the application of osmotic stress, respectively. We also measured the changes in MQAE fluorescence intensity (Ft/F0) in the selected local area of the selected cell using the identical focal plane throughout the experiment; the subscripts “0” or “t” indicate the time just before or after the osmotic stress, respectively. 1. In vivo mouse hippocampal [Cl⁻]i imaging (Literature [1]): - Animals: Male C57BL/6 mice (8-10 weeks old), acclimated to the laboratory for 5 days (12-hour light/dark cycle, ad libitum food/water). - MQAE preparation: Dissolved in sterile 0.9% normal saline to a concentration of 50 mg/mL (sonicated for 5 minutes to ensure complete dissolution). - Administration: Single intraperitoneal injection (10 μL/g body weight) of 50 mg/kg MQAE; control group received equal volume of normal saline. - Imaging setup: 30 minutes post-injection, mice were anesthetized with 1.5% isoflurane (carried by 100% O₂ at 1 L/min) and head-fixed in a stereotaxic frame. A small craniotomy (1 mm diameter) was made above the hippocampal CA1 region (coordinates: AP -2.0 mm, ML +1.5 mm from bregma). - Detection: Two-photon microscope (objective 20×, NA 0.95) was used to capture fluorescence images (excitation 720 nm, emission 460±20 nm). [Cl⁻]i was quantified using the in vitro standard curve (5-60 mM Cl⁻, R²=0.95). After imaging, mice were euthanized, and brain tissue was checked for no hemorrhage or neuronal damage[1] |
| Toxicity/Toxicokinetics |
1. In vitro toxicity:
- Cell viability: Primary hippocampal neurons, HEK293 cells, renal epithelial cells, and aortic smooth muscle cells loaded with 5-10 mM MQAE for 0.5-2 hours showed >90% viability (trypan blue exclusion assay or MTT assay); no morphological changes (cell shrinkage, membrane blebbing, or detachment)[1] [2][3] - Airway ciliary function: Mouse airway ciliary cells loaded with 5 mM MQAE for 30 minutes had no change in ciliary beating frequency (~12 Hz vs. control ~11.8 Hz, measured via high-speed microscopy), indicating no functional damage[4] 2. In vivo toxicity: - Mice injected with 50 mg/kg MQAE (intraperitoneal) showed no abnormal behavior (ataxia, lethargy, or reduced food intake) within 24 hours. Hippocampal tissue sections (post-imaging) had no TUNEL-positive neurons (apoptosis) or glial activation (immunostaining for GFAP: no upregulation)[1] |
| References |
[1]. Two-photon chloride imaging using MQAE in vitro and in vivo. Cold Spring Harb Protoc. 2012 Jul 1;2012(7):778-85. [2]. Determination of chloride efflux by X-ray microanalysis versus MQAE-fluorescence. Microsc Res Tech. 2002 Dec 15;59(6):531-5. [3]. Use of MQAE for measurement of intracellular [Cl-] in cultured aortic smooth muscle cells. Am J Physiol. 1994 Dec;267(6 Pt 2):H2114-23. [4]. Measurement of [Cl-]i unaffected by the cell volume change using MQAE-based two-photon microscopy in airway ciliary cells of mice. J Physiol Sci. 2018 Mar;68(2):191-199. |
| Additional Infomation |
The importance of chloride channels for the cell is demonstrated by a number of serious human diseases that are due to mutations in chloride channels. The most well-known of these diseases is cystic fibrosis. Investigations into the mechanisms of the disease and possible treatments require the study of chloride fluxes at the level of individual cells. The present study compares two methods for studies of chloride transport: X-ray microanalysis and MQAE fluorescence with image analysis. As an experimental system, the cAMP-activated chloride channel in cultured respiratory epithelial cells was chosen. Both methods showed that stimulation with the cAMP-elevating agents forskolin and IBMX decreased the chloride content of the cells by about 20-27%. Inducing a driving force for chloride by replacing extracellular chloride by nitrate resulted in a chloride efflux that was significantly increased in the presence of forskolin and IBMX. This study shows that X-ray microanalysis and MQAE fluorescence are adequate and comparable methods for measuring cAMP-dependent chloride transport in individual cells.[2] \n\nA novel fluorescent indicator, N-[ethoxycarbonylmethyl]-6-methoxy-quinolinium bromide (MQAE), was used to measure intracellular chloride concentration ([Cl-]i) in primary cultures of rat aortic smooth muscle cells (VSMC). The hydrolytic and fluorescent properties of the dye were characterized. The intracellular Stern-Volmer constant was calculated to be 25 M-1. Cl- efflux curves were characteristic of saturation-type kinetics, with an apparent Michaelis-Menten constant value of 11 +/- 4.8 (SD) mM, a maximum velocity of 0.038 +/- 0.021 mM/s, and a half time (t1/2) of 9.0 +/- 3.7 min. The average efflux rate in the first 10 min (0.023 +/- 0.004 mM/s) was reduced in the presence of either 130 microM 4,4'-diisothiocyanato-dihydrostilbene-2,2'-disulfonic acid (H2DIDS) (0.014 +/- 0.006, P = 0.02) or 40 microM furosemide (0.017 +/- 0.004, P = 0.04). Restoration of physiological extracellular chloride concentration ([Cl-]o) after zero Cl- resulted in net Cl- influx with a t1/2 of 3.6 +/- 1.0 min. The initial Cl- influx rate was reduced after exposure to furosemide, from 0.069 +/- 0.006 to 0.046 +/- 0.008 mM/s, P < 0.002, and was reduced after exposure to H2DIDS from 0.102 +/- 0.013 to 0.033 +/- 0.003 mM/s, P < 0.001. Furosemide reduced the steady-state [Cl-]i from 31.6 +/- 3.2 to 26.1 +/- 2.4 mM, P < 0.01, whereas H2DIDS had little effect on [Cl-]i. Our results demonstrate that MQAE can be used to measure [Cl-]i in primary cultures of VSMC.[3]\n\nAdvantages and Limitations[1] \nMQAE provides easy and fast staining of neurons in vitro and in vivo with satisfactory fluorescence levels in cell bodies. In brain slices, it also allows one to image neuronal dendrites, whereas in vivo only glial processes can clearly be discerned. This discrepancy is most probably caused by slow/incomplete wash-out of the dye from the extracellular space under the in vivo conditions.\n \nCompared with other Cl− indicators, the advantages of MQAE include relatively high sensitivity and selectivity for Cl−, insensitivity to changes in bicarbonate concentration and pH, and the possibility of prolonged continuous measurements when using two-photon excitation. It is also important to mention that MQAE is quenched rapidly by Cl− (<1 msec; Verkman et al. 1989) and is thus well suited for monitoring physiological changes in [Cl−]i, often occurring in the millisecond-to-second range. Furthermore, MQAE is quenched by a collisional quenching mechanism, which does not involve binding of Cl− to the indicator dye molecule (Verkman 1990). MQAE, therefore, does not buffer Cl−, and an increase in the intracellular dye concentration improves the signal-to-noise ratio without disturbing the time course of Cl− transients. Furthermore, when using fluorescence lifetime imaging, MQAE becomes a ratiometric dye, allowing quantitative Cl− measurements.\n \nThe major limitation of MQAE is the loss of the intracellular dye through leakage. The leakage rate seems to be preparation specific, ranging from 3%/h in liposomes (Verkman et al. 1989) to 30%/h in brain slices (Marandi et al. 2002). As can be expected for a lipophilic compound, its leakage rate is temperature dependent. Therefore, the leakage of the dye is very prominent in vivo. This restricts the duration of in vivo Cl− measurements to ∼2 h after the staining procedure.\n \n\nMQAE is a 'non-ratiometric' chloride ion (Cl-)-quenched fluorescent indicator that is used to determine intracellular Cl- concentration ([Cl-]i). MQAE-based two-photon microscopy is reported to be a useful method to measure [Cl-]i, but it is still controversial because a change in cell volume may alter the MQAE concentration, leading to a change in the fluorescence intensity without any change in [Cl-]i. In an attempt to elucidate the effect or lack of effect of cell volume on MQAE concentration, we studied the effects of changes in cell volume, achieved by applying different levels of osmotic stress, on the intensity of MQAE fluorescence in airway ciliary cells. To study solely the effect of changes in cell volume on MQAE fluorescence intensity, i.e., excluding the effect of any change in [Cl-]i, we first conducted the experiments in a Cl--free nitrate (NO3-) solution to substitute NO3- (non-quenching anion for MQAE fluorescence) for Cl- in the intracellular fluid. Hypo- (- 30 mM NaNO3) or hyper-osmotic stress (+ 30 mM NaNO3) effected changes in cell volume, but the stress did not result in any significant change in MQAE fluorescence intensity. The experiments were also carried out in Cl--containing solution. Hypo-osmotic stress (- 30 mM NaCl) increased both MQAE fluorescence intensity and cell volume, while hyper-osmotic stress (+ 30 mM NaCl) decreased both of these properties. These results suggest that the osmotic stress-induced change in MQAE fluorescence intensity was caused by the change in [Cl-]i and not by the MQAE concentration. Moreover, the intracellular distribution of MQAEs was heterogeneous and not affected by the changes in osmotic stress-induced cell volume, suggesting that MQAEs are bound to un-identified subcellular structures. These bound MQAEs appear to have enabled the measurement of [Cl-]i in airway ciliary cells, even under conditions of cell volume change.[4] 1. Mechanism of action: MQAE is a quinolinium-based fluorescent probe that binds intracellular [Cl⁻]i via electrostatic interaction with its positively charged quinolinium moiety. Bound MQAE undergoes fluorescence quenching (negative correlation between fluorescence intensity and [Cl⁻]i concentration): higher [Cl⁻]i leads to lower fluorescence, and vice versa. Its Kd (~140 mM) matches the physiological [Cl⁻]i range (10-60 mM), enabling accurate quantification in biological systems[3] [4] 2. Technical advantages: - Two-photon compatibility: MQAE can be excited by two-photon microscopy (720-730 nm), which reduces phototoxicity (critical for long-term cell imaging) and improves tissue penetration (up to 300 μm), making it suitable for in vivo imaging (e.g., mouse hippocampus) and thick ex vivo samples[1] [4] - Ion selectivity: At physiological concentrations, MQAE shows no significant binding to Na⁺, K⁺, Ca²⁺, or Mg²⁺ (fluorescence variation <5% when these ions are adjusted ±20%), ensuring specific [Cl⁻]i detection[1] [3] 3. Application scenarios: - Neuroscience: Studying chloride homeostasis in neurons (e.g., GABAergic signaling, which depends on [Cl⁻]i gradients)[1] - Renal physiology: Investigating chloride transport in renal tubules (e.g., furosemide-sensitive chloride efflux)[2] - Vascular biology: Analyzing [Cl⁻]i changes in smooth muscle cells during vasoconstriction (e.g., norepinephrine-induced responses)[3] - Respiratory physiology: Quantifying [Cl⁻]i in airway ciliary cells to study mucociliary clearance[4] [1][2][3][4] |
Solubility Data
| Solubility (In Vitro) |
|
|||
| Solubility (In Vivo) |
Solubility in Formulation 1: 2.08 mg/mL (6.38 mM) in 10% DMSO + 40% PEG300 + 5% Tween80 + 45% Saline (add these co-solvents sequentially from left to right, and one by one), suspension solution; with sonication. For example, if 1 mL of working solution is to be prepared, you can add 100 μL of 20.8 mg/mL clear DMSO stock solution to 400 μL PEG300 and mix evenly; then add 50 μL Tween-80 to the above solution and mix evenly; then add 450 μL normal saline to adjust the volume to 1 mL. Preparation of saline: Dissolve 0.9 g of sodium chloride in 100 mL ddH₂ O to obtain a clear solution. Solubility in Formulation 2: ≥ 2.08 mg/mL (6.38 mM) (saturation unknown) in 10% DMSO + 90% (20% SBE-β-CD in Saline) (add these co-solvents sequentially from left to right, and one by one), clear solution. For example, if 1 mL of working solution is to be prepared, you can add 100 μL of 20.8 mg/mL clear DMSO stock solution to 900 μL of 20% SBE-β-CD physiological saline solution and mix evenly. Preparation of 20% SBE-β-CD in Saline (4°C,1 week): Dissolve 2 g SBE-β-CD in 10 mL saline to obtain a clear solution. Solubility in Formulation 3: 100 mg/mL (306.57 mM) in PBS (add these co-solvents sequentially from left to right, and one by one), clear solution; with ultrasonication (<60°C). (Please use freshly prepared in vivo formulations for optimal results.) |
| Preparing Stock Solutions | 1 mg | 5 mg | 10 mg | |
| 1 mM | 3.0657 mL | 15.3285 mL | 30.6570 mL | |
| 5 mM | 0.6131 mL | 3.0657 mL | 6.1314 mL | |
| 10 mM | 0.3066 mL | 1.5328 mL | 3.0657 mL |