GSK-LSD1 is a novel, potent, irreversible, and selective LSD1 (lysine specific demethylase 1) inhibitor with IC50 of 16 nM, it is > 1000 fold selective over other closely related FAD utilizing enzymes (i.e. LSD2, MAO-A, MAO-B). LSD1 is involved in ES cell differentiation, hematopoiesis, and has been described as having a role in Acute Myeloid Leukemia (AML). GSK-LSD1 potently inhibits proliferation of varies cancer cell lines by changing gene expression patterns. GSK-LSD1 induces gene expression changes in cancer cell lines (average EC50 < 5 nM) and inhibits cancer cell line growth (average EC50 < 5 nM).
Physicochemical Properties
| CAS # | 1431368-50-1 |
| Related CAS # | GSK-LSD1 dihydrochloride;2102933-95-7 |
| Appearance | Typically exists as solid at room temperature |
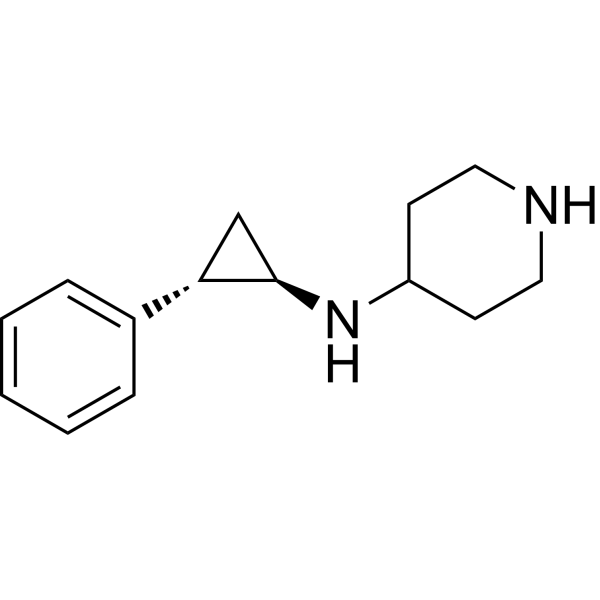
| Chemical Name | N-((1R,2S)-2-phenylcyclopropyl)piperidin-4-amine |
| Synonyms | GSK-LSD1 HCl; GSK-LSD1 2HCl; GSK-LSD1; GSK-LSD-1; GSK-LSD 1 |
| HS Tariff Code | 2934.99.9001 |
| Storage |
Powder-20°C 3 years 4°C 2 years In solvent -80°C 6 months -20°C 1 month |
| Shipping Condition | Room temperature (This product is stable at ambient temperature for a few days during ordinary shipping and time spent in Customs) |
Biological Activity
| Targets | LSD1/lysine specific demethylase 1 | ||
| ln Vitro |
|
||
| ln Vivo | To assess the activity of LSD1 inhibition in vivo, secondary recipient mice engrafted with 1 × 10~5 MLL-AF9 primary AML cells were treated with GSK-LSD1. The drug was administered daily during a 14-day treatment window at a dose of 0.5 mg/kg. Treatment was initiated only after peripheral blood engraftment was confirmed (supplemental Figure 1A, available on the Blood Web site). After treatment, some mice were killed and analyzed using flow cytometric detection of GFP as a readout of MLL-AF9 allele burden. GSK-LSD1–treated mice exhibited a lower proportion of GFP+ cells in the bone marrow (Figure 1A), peripheral blood, and spleen (supplemental Figure 1B-C). Other measures of disease burden, including spleen weight, were markedly reduced in the setting of GSK-LSD1 treatment (supplemental Figure 1E). Mice treated with GSK-LSD1 exhibited a significant decline in platelet count (P = .003; supplemental Figure 1D), which is consistent with an on-target effect of LSD1 depletion.18 Immunophenotyping of bone marrow cells after 3 days of GSK-LSD1 treatment revealed a reduction of more primitive GFP+ leukemia cells coexpressing c-kit and Mac-1 (Figure 1B). GSK-LSD1–treated mice also had markedly improved survival (median survival, 78 days) compared with control mice (median survival, 39 days) (Figure 1C). Strikingly, a small proportion of treated mice had no detectable disease even 248 days after transplantation. In order to confirm this effect of LSD1 inhibition on survival, we performed serial transplantation of MLL-AF9 cells harvested from leukemic mice treated for 3 days with either vehicle alone or GSK-LSD1. Equivalent numbers of GFP+ cells purified from vehicle- or GSK-LSD1–treated mice were injected into sublethally irradiated mice. Tertiary recipient mice transplanted with cells harvested from GSK-LSD1–treated mice had improved survival when compared with vehicle-treated mice. While recipient mice transplanted with vehicle-treated cells had a median survival of 23 days, mice challenged with GSK-LSD1–treated leukemia cells had a median survival of 51 days (Figure 1D). Only 50% of the mice engrafted with GSK-LSD1–treated leukemia cells succumbed to AML. The remaining 50% of the mice transplanted with GSK-LSD1–treated cells remained healthy up to 308 days after transplantation and showed no signs of leukemia. These data suggest that LSD1 inhibition has potent antileukemic activity, improves overall survival, and occasionally causes complete disease eradication in an aggressive model of MLL-AF9–driven AML.https://pmc.ncbi.nlm.nih.gov/articles/PMC5897868/ | ||
| Cell Assay |
Cell cycle analysis Cell cycle analysis was performed by BrdU staining of cells treated in vitro for 48 hours with GSKLSD1. BrdU Flow Kit (BD Biosciences) was used. Briefly, after 48 hours of exposure to GSK-LSD1, cells were exposed to 10 µM BrdU per manufacturer’s instructions for 20 min. After this, cells were harvested, permeabilized and stained with anti-BrdU antibody labelled with APC, while leukemic cells were GFP+ (harbouring pMSCV-MLL-AF9-IRES-GFP plasmid). For DNA staining SYTOX™ Blue Dead Cell Stain was used. The SYTOX Blue signal was acquired in a linear mode. https://pmc.ncbi.nlm.nih.gov/articles/PMC5897868/#sec12 MLL-AF9 leukemia cells were treated in vitro by culturing cells in IMDM supplemented with 15% FBS, IL-3, IL-6, and mSCF with the addition of vehicle alone or GSK-LSD1 at a concentration of 0.5 µM for 48 hours. Similarly, leukemia cells were treated with the DOT1L inhibitor EPZ4777 for 6 days at a concentration of 1 µM. Colony forming assays were performed according to manufacturer’s instructions. Briefly, 500 cells/dish were plated in MC3434 methylcellulose and numbers of colonies were scored after 6 days of incubation. For each arm 3 independent dishes were scored, and colony assays were performed at least in duplicate. GSK-LSD1 was added to MC3434 semisolid medium at day 0 at a concentration of 0.5 µM and colonies were scored six days later.https://pmc.ncbi.nlm.nih.gov/articles/PMC5897868/#sec12 |
||
| Animal Protocol |
|
||
| References | Biochim Biophys Acta. 2017 Aug 8;1864(12):2428-2437.; http://www.thesgc.org/chemical-probes/LSD1. | ||
| Additional Infomation |
Epigenetic factors and related small molecules have emerged to be strongly involved in autophagy process. Here we report that 2-PCPA and GSK-LSD1, two inhibitors of histone H3K4 demethylase KDM1A/LSD1, induce autophagy in multiple mammalian cell lines. The two small molecules induce accumulation of LC3II, formation of autophagosome and autolysosome, and SQSTM1/p62 degradation. 2-PCPA treatment inhibits cell proliferation through cell cycle arrest but does not inducing cell death. Exogenous expression of KDM1A/LSD1 impaired the autophagic phenotypes triggered by 2-PCPA. The autophagy induced by 2-PCPA requires LC3-II processing machinery. But depletion of BECN1 and ULK1 with siRNA did not affect the LC3-II accumulation triggered by 2-PCPA. 2-PCPA treatment induces the change of global gene expression program, including a series of autophagy-related genes, such as SQSTM1/p62. Taken together, our data indicate that KDM1A/LSD1 inhibitors induce autophagy through affecting the expression of autophagy-related genes and in a BECN1-independent manner.Biochim Biophys Acta. 2017 Aug 8;1864(12):2428-2437 Epigenetic regulators are recurrently mutated and aberrantly expressed in acute myeloid leukemia (AML). Targeted therapies designed to inhibit these chromatin-modifying enzymes, such as the histone demethylase lysine-specific demethylase 1 (LSD1) and the histone methyltransferase DOT1L, have been developed as novel treatment modalities for these often refractory diseases. A common feature of many of these targeted agents is their ability to induce myeloid differentiation, suggesting that multiple paths toward a myeloid gene expression program can be engaged to relieve the differentiation blockade that is uniformly seen in AML. We performed a comparative assessment of chromatin dynamics during the treatment of mixed lineage leukemia (MLL)-AF9-driven murine leukemias and MLL-rearranged patient-derived xenografts using 2 distinct but effective differentiation-inducing targeted epigenetic therapies, the LSD1 inhibitor GSK-LSD1 and the DOT1L inhibitor EPZ4777. Intriguingly, GSK-LSD1 treatment caused global gains in chromatin accessibility, whereas treatment with EPZ4777 caused global losses in accessibility. We captured PU.1 and C/EBPα motif signatures at LSD1 inhibitor-induced dynamic sites and chromatin immunoprecipitation coupled with high-throughput sequencing revealed co-occupancy of these myeloid transcription factors at these sites. Functionally, we confirmed that diminished expression of PU.1 or genetic deletion of C/EBPα in MLL-AF9 cells generates resistance of these leukemias to LSD1 inhibition. These findings reveal that pharmacologic inhibition of LSD1 represents a unique path to overcome the differentiation block in AML for therapeutic benefit.https://pmc.ncbi.nlm.nih.gov/articles/PMC5897868/#sec12 |
Solubility Data
| Solubility (In Vitro) | May dissolve in DMSO (in most cases), if not, try other solvents such as H2O, Ethanol, or DMF with a minute amount of products to avoid loss of samples |
| Solubility (In Vivo) |
Note: Listed below are some common formulations that may be used to formulate products with low water solubility (e.g. < 1 mg/mL), you may test these formulations using a minute amount of products to avoid loss of samples. Injection Formulations (e.g. IP/IV/IM/SC) Injection Formulation 1: DMSO : Tween 80: Saline = 10 : 5 : 85 (i.e. 100 μL DMSO stock solution → 50 μL Tween 80 → 850 μL Saline) *Preparation of saline: Dissolve 0.9 g of sodium chloride in 100 mL ddH ₂ O to obtain a clear solution. Injection Formulation 2: DMSO : PEG300 :Tween 80 : Saline = 10 : 40 : 5 : 45 (i.e. 100 μL DMSO → 400 μLPEG300 → 50 μL Tween 80 → 450 μL Saline) Injection Formulation 3: DMSO : Corn oil = 10 : 90 (i.e. 100 μL DMSO → 900 μL Corn oil) Example: Take the Injection Formulation 3 (DMSO : Corn oil = 10 : 90) as an example, if 1 mL of 2.5 mg/mL working solution is to be prepared, you can take 100 μL 25 mg/mL DMSO stock solution and add to 900 μL corn oil, mix well to obtain a clear or suspension solution (2.5 mg/mL, ready for use in animals). Injection Formulation 4: DMSO : 20% SBE-β-CD in saline = 10 : 90 [i.e. 100 μL DMSO → 900 μL (20% SBE-β-CD in saline)] *Preparation of 20% SBE-β-CD in Saline (4°C,1 week): Dissolve 2 g SBE-β-CD in 10 mL saline to obtain a clear solution. Injection Formulation 5: 2-Hydroxypropyl-β-cyclodextrin : Saline = 50 : 50 (i.e. 500 μL 2-Hydroxypropyl-β-cyclodextrin → 500 μL Saline) Injection Formulation 6: DMSO : PEG300 : castor oil : Saline = 5 : 10 : 20 : 65 (i.e. 50 μL DMSO → 100 μLPEG300 → 200 μL castor oil → 650 μL Saline) Injection Formulation 7: Ethanol : Cremophor : Saline = 10: 10 : 80 (i.e. 100 μL Ethanol → 100 μL Cremophor → 800 μL Saline) Injection Formulation 8: Dissolve in Cremophor/Ethanol (50 : 50), then diluted by Saline Injection Formulation 9: EtOH : Corn oil = 10 : 90 (i.e. 100 μL EtOH → 900 μL Corn oil) Injection Formulation 10: EtOH : PEG300:Tween 80 : Saline = 10 : 40 : 5 : 45 (i.e. 100 μL EtOH → 400 μLPEG300 → 50 μL Tween 80 → 450 μL Saline) Oral Formulations Oral Formulation 1: Suspend in 0.5% CMC Na (carboxymethylcellulose sodium) Oral Formulation 2: Suspend in 0.5% Carboxymethyl cellulose Example: Take the Oral Formulation 1 (Suspend in 0.5% CMC Na) as an example, if 100 mL of 2.5 mg/mL working solution is to be prepared, you can first prepare 0.5% CMC Na solution by measuring 0.5 g CMC Na and dissolve it in 100 mL ddH2O to obtain a clear solution; then add 250 mg of the product to 100 mL 0.5% CMC Na solution, to make the suspension solution (2.5 mg/mL, ready for use in animals). Oral Formulation 3: Dissolved in PEG400 Oral Formulation 4: Suspend in 0.2% Carboxymethyl cellulose Oral Formulation 5: Dissolve in 0.25% Tween 80 and 0.5% Carboxymethyl cellulose Oral Formulation 6: Mixing with food powders Note: Please be aware that the above formulations are for reference only. InvivoChem strongly recommends customers to read literature methods/protocols carefully before determining which formulation you should use for in vivo studies, as different compounds have different solubility properties and have to be formulated differently. (Please use freshly prepared in vivo formulations for optimal results.) |