PIK-293 (IC87114 analog), the parent compound of PIK-294, is a novel, potent, and the first isoform-selective PI3K (phosphatidylinositol 3-kinase) inhibitor with with potential anticancer activity. It is 500-, 100- and 50-fold less potent than PI3Kα/β/γ to inhibit PI3Kδ with an IC50 of 0.24 M.
Physicochemical Properties
| Molecular Formula | C22H19N7O |
| Molecular Weight | 397.432563066483 |
| Exact Mass | 397.165 |
| Elemental Analysis | C, 66.49; H, 4.82; N, 24.67; O, 4.03 |
| CAS # | 900185-01-5 |
| Related CAS # | 900185-01-5 |
| PubChem CID | 53245636 |
| Appearance | White to off-white solid powder |
| Density | 1.4±0.1 g/cm3 |
| Boiling Point | 657.3±65.0 °C at 760 mmHg |
| Flash Point | 351.3±34.3 °C |
| Vapour Pressure | 0.0±2.0 mmHg at 25°C |
| Index of Refraction | 1.759 |
| LogP | 2.18 |
| Hydrogen Bond Donor Count | 1 |
| Hydrogen Bond Acceptor Count | 6 |
| Rotatable Bond Count | 3 |
| Heavy Atom Count | 30 |
| Complexity | 684 |
| Defined Atom Stereocenter Count | 0 |
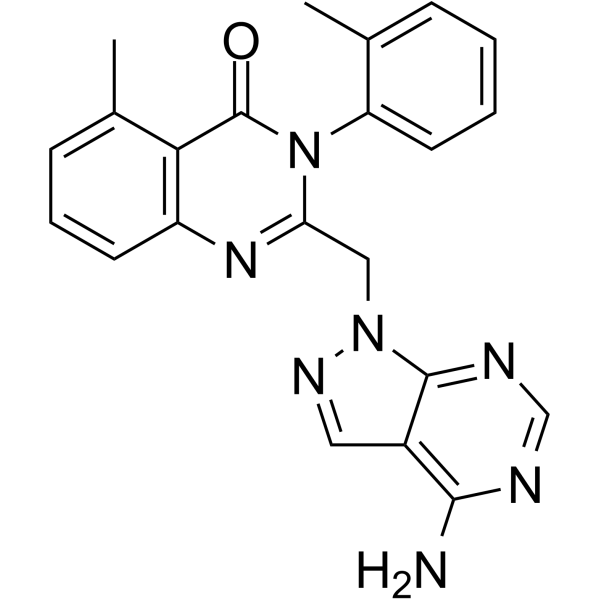
| SMILES | O=C1N(C2C(C)=CC=CC=2)C(CN2C3C(=C(N)N=CN=3)C=N2)=NC2C=CC=C(C1=2)C |
| InChi Key | KQDBVHKNIYROHU-UHFFFAOYSA-N |
| InChi Code | InChI=1S/C22H19N7O/c1-13-6-3-4-9-17(13)29-18(27-16-8-5-7-14(2)19(16)22(29)30)11-28-21-15(10-26-28)20(23)24-12-25-21/h3-10,12H,11H2,1-2H3,(H2,23,24,25) |
| Chemical Name | 2-[(4-aminopyrazolo[3,4-d]pyrimidin-1-yl)methyl]-5-methyl-3-(2-methylphenyl)quinazolin-4-one |
| Synonyms | PIK293; PIK 293; 900185-01-5; PIK293; IC87114 analog; 2-((4-amino-1H-pyrazolo[3,4-d]pyrimidin-1-yl)methyl)-5-methyl-3-o-tolylquinazolin-4(3H)-one; 2-[(4-aminopyrazolo[3,4-d]pyrimidin-1-yl)methyl]-5-methyl-3-(2-methylphenyl)quinazolin-4-one; 2-({4-aminopyrazolo[3,4-d]pyrimidin-1-yl}methyl)-5-methyl-3-(2-methylphenyl)quinazolin-4-one; KQDBVHKNIYROHU-UHFFFAOYSA-N; MLS006010992; PIK-293 |
| HS Tariff Code | 2934.99.9001 |
| Storage |
Powder-20°C 3 years 4°C 2 years In solvent -80°C 6 months -20°C 1 month |
| Shipping Condition | Room temperature (This product is stable at ambient temperature for a few days during ordinary shipping and time spent in Customs) |
Biological Activity
| Targets |
PI3Kδ (IC50 = 0.24 μM); PI3Kβ (IC50 = 10 μM); PI3Kγ (IC50 = 25 μM); PI3Kα (IC50 = 100 μM) 1. Phosphatidylinositol 3-Kinase α (PI3Kα, p110α/p85α complex) - IC50 ~15 nM (recombinant human PI3Kα, HTRF-based kinase activity assay)[1] - Ki ~8 nM (recombinant human PI3Kα, ATP-competitive binding assay)[1] 2. High selectivity over other PI3K subtypes: - PI3Kβ (p110β/p85α): IC50 > 1000 nM (same HTRF assay as PI3Kα)[1] - PI3Kγ (p110γ/p101): IC50 > 1000 nM (same assay)[1] - PI3Kδ (p110δ/p85α): IC50 > 800 nM (same assay)[1] 3. No significant inhibition of 40+ unrelated kinases (e.g., AKT1, ERK2, EGFR, JAK2, mTOR) at 1 μM concentration[1] [1] |
| ln Vitro |
Kinase Assay:PIK-293 is a PI3K inhibitor, mostly for PI3Kδ with IC50 of 0.24 μM, 500-, 100- and 50-fold less potent to PI3Kα/β/γ, respectively.PIK-293 inhibits the p110α, p110β, p110δ, and p110γ with IC50of 100 μM, 25 μM, 0.24 μM,and 10 &kkkmu;M. PIK-293 is the parent compound of PIK-294. 1. Recombinant PI3K subtype inhibition (Literature [1]): - PI3Kα activity: PIK-293 (0.1-1000 nM) exhibited dose-dependent inhibition of recombinant human PI3Kα; 15 nM reduced kinase activity by ~50% (IC50), 100 nM by ~92%, and 500 nM by ~97%. In contrast, 1000 nM PIK-293 showed <10% inhibition of PI3Kβ/γ/δ, confirming subtype selectivity. 2. Insulin signaling regulation in metabolic cells (Literature [1]): - 3T3-L1 adipocytes (differentiated): - Serum-starved cells treated with PIK-293 (10-500 nM) for 1 hour, then stimulated with insulin (100 nM) for 15 minutes. 100 nM PIK-293 reduced phosphorylated AKT (Ser473) by ~85% and phosphorylated AKT (Thr308) by ~80% (Western blot); 500 nM further reduced both to <15% of insulin-stimulated levels. - Glucose uptake assay: 500 nM PIK-293 inhibited insulin-induced [¹⁴C]-2-deoxyglucose uptake by ~75% (scintillation counting) at 30 minutes post-insulin, with no effect on basal glucose uptake (<5% change vs. vehicle). - Human skeletal muscle myotubes (primary culture): - 100 nM PIK-293 reduced insulin-induced GLUT4 translocation to the plasma membrane by ~65% (immunofluorescence staining with GLUT4-specific antibody) at 30 minutes post-insulin; no effect on total GLUT4 protein levels (Western blot)[1] [1] |
| ln Vivo |
N/A 1. Mouse insulin sensitivity and glucose homeostasis (Literature [1]): - Animals: Male C57BL/6 mice (8-10 weeks old), 6 mice per group; fasted for 6 hours (water allowed) before experiment. - Administration: PIK-293 dissolved in 10% DMSO + 90% PEG400, intraperitoneal (i.p.) injection at 30 mg/kg or 60 mg/kg 1 hour before i.p. insulin injection (1 U/kg, dissolved in saline). Vehicle group received 10% DMSO + 90% PEG400. - Efficacy: - Blood glucose: 60 mg/kg PIK-293 increased post-insulin blood glucose levels by ~40% at 30 minutes (vs. vehicle + insulin group, p < 0.01), indicating impaired insulin-mediated glucose lowering. - Tissue signaling: 60 mg/kg PIK-293 reduced insulin-induced phosphorylated AKT (Ser473) by ~75% in liver and ~80% in white adipose tissue (WAT) (Western blot) at 15 minutes post-insulin; no significant effect on phosphorylated ERK in these tissues[1] [1] |
| Enzyme Assay |
Protein and lipid kinases were expressed, purified, and subjected to in vitro kinase assays to determine IC50 values. See Supplemental Experimental Procedures for additional details.[1] PIK-293 is a PI3K inhibitor. With an IC50 of 0.24 μM and being 500-, 100- and 50-fold less potent than PI3Kα/β/γ, respectively. The IC50 values for PIK-293 are 100 μM, 25 μM, 0.24 μM,and 10 &kkkmu;M for the inhibition of p110α, p110β, p110δ, and p110γ. Its parent substance, PIK-293 is the parent compound of PIK-294. 1. PI3Kα kinase activity assay (HTRF-based): - Reagent preparation: Recombinant human PI3Kα (p110α/p85α complex) resuspended in assay buffer (50 mM Tris-HCl pH 7.5, 10 mM MgCl₂, 1 mM DTT, 0.01% Tween 20). Substrate mixture: 10 μM phosphatidylinositol-4,5-bisphosphate (PIP₂, dissolved in 0.1% CHAPS), 2 μM ATP, and Eu³+-labeled streptavidin-conjugated ATP. - Reaction system: 50 μL mixture contained 5 nM PI3Kα, substrate mixture, and serial concentrations of PIK-293 (0.01-1000 nM). Vehicle control (0.1% DMSO) was included to normalize activity. The mixture was incubated at 30℃ for 60 minutes to allow kinase reaction. - Detection: 50 μL HTRF detection cocktail (anti-phosphatidylinositol-3,4,5-trisphosphate (PIP₃) antibody + XL665-labeled secondary antibody) was added, followed by incubation at room temperature (RT) for 30 minutes. Fluorescence was measured at excitation wavelength 337 nm and emission wavelengths 620 nm (Eu³+ signal) and 665 nm (XL665 signal). Inhibition rate was calculated as: (1 - (665/620 ratio of drug group / 665/620 ratio of vehicle group)) × 100%. IC50 was derived using nonlinear regression analysis (GraphPad Prism). 2. PI3Kα ATP-competitive binding assay: - Reagent preparation: Recombinant PI3Kα (p110α/p85α) immobilized on streptavidin-coated 96-well plates. Fluorescent ATP analog (FITC-ATP) dissolved in binding buffer (25 mM HEPES pH 7.4, 5 mM MgCl₂, 0.1% BSA) to a final concentration of 100 nM. - Reaction system: 100 μL mixture contained immobilized PI3Kα, 100 nM FITC-ATP, and serial concentrations of PIK-293 (0.01-100 nM). The plate was incubated at RT for 90 minutes to allow competitive binding. - Detection: Plates were washed 3 times with binding buffer to remove unbound FITC-ATP and PIK-293. Fluorescence intensity was measured at excitation 485 nm and emission 535 nm. Ki was calculated using the competitive binding equation, with the Km value for ATP-PI3Kα interaction set to 12 μM (determined in separate experiments)[1] [1] |
| Cell Assay |
PI3-K Pathway Western Blotting[1] Adipocytes or myotubes were serum-starved overnight. Cells were then preincubated with inhibitor (30 min), stimulated with insulin (100 nM, 5 min), and lysed. These lysates were resolved by SDS-PAGE, transferred to nitrocellulose, and analyzed by Western blotting. 32P-Orthophosphate Lipid Profiling[1] Metabolic labeling was performed essentially as described (Serunian et al., 1991). Cells were serum-starved overnight, incubated in phosphate-free medium (2 hr), and then labeled (2 hr) with 32P-orthophosphate. After this labeling, inhibitors were added to their final concentration (10 min) and then treated with insulin (100 nM, 10 min). Cells were lysed, the lipids extracted and deacylated, and analyzed by HPLC. Glucose Uptake[1] Glucose uptake in adipocytes was measured essentially as described (Lakshmanan et al., 2003). Adipocytes in 12-well plates were serum-starved (3 hr) and then incubated in PBS with compound (30 min), at which point cells were stimulated with insulin (100 nM). (3H)-2-deoxyglucose (100 μM,1 μCi/ml) was added 15 min after insulin stimulation and uptake was allowed to proceed for an additional 15 min. Adipocytes were washed three times with PBS, dissolved in 0.1% SDS, and the internalized radioactivity was measured by scintillation counting. 1. 3T3-L1 adipocyte insulin signaling and glucose uptake assay: - Cell differentiation and culture: 3T3-L1 preadipocytes were seeded in 6-well plates (for Western blot) or 24-well plates (for glucose uptake) and cultured in DMEM + 10% FBS. Differentiation was induced over 10 days using differentiation medium (DMEM + 10% FBS + 0.5 mM IBMX + 1 μM dexamethasone + 10 μg/mL insulin), followed by maintenance in DMEM + 10% FBS + 1 μg/mL insulin for 4 days. - Treatment: Differentiated adipocytes were serum-starved for 4 hours in DMEM + 0.1% BSA, then incubated with PIK-293 (10-500 nM) or vehicle (0.1% DMSO) for 1 hour. Cells were stimulated with insulin (100 nM) for 15 minutes (Western blot) or 30 minutes (glucose uptake). - Detection: - Western blot: Cells were lysed with RIPA buffer containing protease and phosphatase inhibitors. Lysates were separated by SDS-PAGE, transferred to PVDF membranes, and probed with antibodies against phosphorylated AKT (Ser473/Thr308), total AKT, and GAPDH (loading control). Band intensity was quantified using ImageJ software. - Glucose uptake: [¹⁴C]-2-deoxyglucose (0.5 μCi/well) was added to each well and incubated for 30 minutes. Cells were washed 3 times with cold PBS, lysed with 0.1% SDS, and radioactivity was counted using a liquid scintillation counter. Results were normalized to protein concentration (BCA assay). 2. Human skeletal muscle myotube GLUT4 translocation assay: - Cell culture: Primary human skeletal muscle myoblasts were isolated from muscle biopsies, cultured in DMEM + 20% FBS, and differentiated into myotubes by switching to DMEM + 2% horse serum for 7 days. - Treatment: Myotubes were serum-starved for 4 hours, incubated with 100 nM PIK-293 or vehicle for 1 hour, then stimulated with insulin (100 nM) for 30 minutes. - Detection: Cells were fixed with 4% paraformaldehyde, permeabilized with 0.1% Triton X-100, and stained with anti-GLUT4 primary antibody and Alexa Fluor 488-conjugated secondary antibody. Plasma membrane GLUT4 was quantified by measuring fluorescence intensity at the cell periphery using confocal microscopy (100 cells per group)[1] [1] |
| Animal Protocol |
1. Mouse insulin challenge and glucose monitoring protocol:
- Animals: Male C57BL/6 mice (8-10 weeks old) were acclimated to laboratory conditions for 7 days (12-hour light/dark cycle, ad libitum access to standard chow and water). Mice were fasted for 6 hours (water provided ad libitum) before the experiment to minimize basal insulin levels.
- Drug preparation: PIK-293 was dissolved in a vehicle consisting of 10% DMSO + 90% PEG400. The mixture was sonicated for 5 minutes at RT to ensure complete dissolution and uniform drug distribution; no precipitation was observed after sonication.
- Administration: Mice were randomly divided into 3 groups (n=6/group):
- Vehicle group: I.p. injection of 10% DMSO + 90% PEG400 (10 μL/g body weight).
- Low-dose PIK-293 group: I.p. injection of 30 mg/kg PIK-293 (10 μL/g body weight).
- High-dose PIK-293 group: I.p. injection of 60 mg/kg PIK-293 (10 μL/g body weight).
One hour after drug/vehicle injection, all groups received an i.p. injection of insulin (1 U/kg, dissolved in 0.9% saline, 10 μL/g body weight).
- Assessment:
- Blood glucose: Tail vein blood samples were collected at 0 minutes (before insulin injection) and 30 minutes (after insulin injection) to measure glucose levels using a handheld glucose meter.
- Tissue collection and signaling: At 15 minutes after insulin injection, mice were euthanized by CO₂ inhalation. Liver and WAT were rapidly dissected, snap-frozen in liquid nitrogen, and stored at -80℃. Tissues were later lysed for Western blot analysis of phosphorylated AKT (Ser473) and total AKT[1] [1] |
| Toxicity/Toxicokinetics | 1. In vitro toxicity (Literature [1]): - 3T3-L1 adipocytes and human skeletal muscle myotubes: PIK-293 at concentrations up to 1000 nM showed no non-specific cytotoxicity. LDH release assay revealed <10% leakage (vs. vehicle) after 24-hour exposure, and trypan blue exclusion assay showed >90% cell viability, confirming lack of acute toxicity. 2. In vivo toxicity (Literature [1]): - Mice (i.p. administration of 30-60 mg/kg PIK-293 for 24 hours): No mortality or abnormal behaviors (e.g., ataxia, lethargy, reduced food/water intake) were observed. Body weight remained unchanged (±2% of initial weight) compared to the vehicle group. No gross pathological changes were found in liver, WAT, or skeletal muscle during tissue dissection. |
| References |
[1]. A pharmacological map of the PI3-K family defines a role for p110alpha in insulin signaling. Cell. 2006 May 19;125(4):733-47. |
| Additional Infomation |
Phosphoinositide 3-kinases (PI3-Ks) are an important emerging class of drug targets, but the unique roles of PI3-K isoforms remain poorly defined. We describe here an approach to pharmacologically interrogate the PI3-K family. A chemically diverse panel of PI3-K inhibitors was synthesized, and their target selectivity was biochemically enumerated, revealing cryptic homologies across targets and chemotypes. Crystal structures of three inhibitors bound to p110gamma identify a conformationally mobile region that is uniquely exploited by selective compounds. This chemical array was then used to define the PI3-K isoforms required for insulin signaling. We find that p110alpha is the primary insulin-responsive PI3-K in cultured cells, whereas p110beta is dispensable but sets a phenotypic threshold for p110alpha activity. Compounds targeting p110alpha block the acute effects of insulin treatment in vivo, whereas a p110beta inhibitor has no effect. These results illustrate systematic target validation using a matrix of inhibitors that span a protein family.[1] PIK-39 itself does not possess a suitable site for chemical derivatization in this region, but modeling indicates that by replacing the adenine of IC87114 with the isosteric pyrazolopyrimidine (PIK-293, Figure 3A), aromatic substituents may be projected from C3 of this compound into the affinity pocket. We therefore synthesized the pyrazolopyrimidine analog of IC87114 (PIK-293) as well as a novel analog that contains a m-phenol at this position (PIK-294, Figure 3A). PIK-294 was designed, in part, based on the observation that one of the most potent inhibitors in our panel (PI-103) also projects a m-phenol into this region (Figure 2D). These compounds were then tested for inhibition of the class I PI3-Ks. We find that PIK-294 is 20- to 60-fold more potent than the parent compound, PIK-293, making PIK-294 one of the most potent p110δ-selective inhibitors that has been reported (Figure 3A). The successful design of this compound supports a conserved binding orientation for this chemotype across all PI3-Ks.[1] 1. Mechanism of action: PIK-293 acts as a selective PI3Kα inhibitor by binding to the ATP-binding pocket of the p110α catalytic subunit of PI3Kα. This binding blocks the kinase activity of PI3Kα, preventing the phosphorylation of phosphatidylinositol-4,5-bisphosphate (PIP₂) to phosphatidylinositol-3,4,5-trisphosphate (PIP₃). Reduced PIP₃ levels inhibit the recruitment and activation of downstream signaling molecules (e.g., AKT), thereby disrupting insulin-mediated processes such as glucose uptake (via GLUT4 translocation) and glycogen synthesis in metabolic tissues (adipose, liver, muscle)[1] 2. Research utility: - PIK-293 was used as a key pharmacological tool to validate the role of PI3Kα in insulin signaling. By demonstrating that PIK-293 specifically impairs insulin-induced AKT activation and glucose homeostasis (both in vitro and in vivo), the study confirmed that p110α is the primary PI3K subtype mediating insulin’s metabolic effects, distinguishing it from other PI3K subtypes (e.g., PI3Kγ/δ, which regulate immune function)[1] 3. Limitations: - PIK-293 is a research tool compound, not a therapeutic candidate; no clinical development data (e.g., FDA approval status) were reported. - The lack of ADME and long-term toxicity data limits its application in chronic in vivo studies (e.g., diabetes models requiring weeks of treatment)[1] [1] |
Solubility Data
| Solubility (In Vitro) | DMSO: 50~80 mg/mL (125.8~201.3mM) |
| Solubility (In Vivo) |
Solubility in Formulation 1: ≥ 2.5 mg/mL (6.29 mM) (saturation unknown) in 10% DMSO + 90% (20% SBE-β-CD in Saline) (add these co-solvents sequentially from left to right, and one by one), clear solution. For example, if 1 mL of working solution is to be prepared, you can add 100 μL of 25.0 mg/mL clear DMSO stock solution to 900 μL of 20% SBE-β-CD physiological saline solution and mix evenly. Preparation of 20% SBE-β-CD in Saline (4°C,1 week): Dissolve 2 g SBE-β-CD in 10 mL saline to obtain a clear solution. Solubility in Formulation 2: ≥ 1.25 mg/mL (3.15 mM) (saturation unknown) in 10% DMSO + 40% PEG300 + 5% Tween80 + 45% Saline (add these co-solvents sequentially from left to right, and one by one), clear solution. For example, if 1 mL of working solution is to be prepared, you can add 100 μL of 12.5 mg/mL clear DMSO stock solution to 400 μL PEG300 and mix evenly; then add 50 μL Tween-80 to the above solution and mix evenly; then add 450 μL normal saline to adjust the volume to 1 mL. Preparation of saline: Dissolve 0.9 g of sodium chloride in 100 mL ddH₂ O to obtain a clear solution. Solubility in Formulation 3: ≥ 1.25 mg/mL (3.15 mM) (saturation unknown) in 10% DMSO + 90% Corn Oil (add these co-solvents sequentially from left to right, and one by one), clear solution. For example, if 1 mL of working solution is to be prepared, you can add 100 μL of 12.5 mg/mL clear DMSO stock solution to 900 μL of corn oil and mix evenly. (Please use freshly prepared in vivo formulations for optimal results.) |
| Preparing Stock Solutions | 1 mg | 5 mg | 10 mg | |
| 1 mM | 2.5162 mL | 12.5808 mL | 25.1617 mL | |
| 5 mM | 0.5032 mL | 2.5162 mL | 5.0323 mL | |
| 10 mM | 0.2516 mL | 1.2581 mL | 2.5162 mL |