Thiomyristoyl, a thiomyristoyl lysine compound, is a novel, potent and specific SIRT2 inhibitor with IC50 of 28 nM. In mouse models of breast cancer and a variety of human cancer cells, thiomyristoyl demonstrated broad-spectrum anticancer activity; however, it had minimal effect on non-cancerous cells. The lack of powerful and targeted inhibitors and inconsistent data have made targeting sirtuins for cancer treatment a contentious issue. The ability of thiomyristoyl to lower c-Myc levels is correlated with its anticancer effect. The limited effects of thiomyristoyl on tumor-free mice and non-cancerous cells indicate that cancer cells have a greater reliance on SIRT2, which may be used therapeutically. A potential general strategy to target some c-Myc driven cancers is thiomyristoyl, a promising anticancer agent.
Physicochemical Properties
| Molecular Formula | C34H51N3O3S |
| Molecular Weight | 581.8520 |
| Exact Mass | 581.37 |
| Elemental Analysis | C, 70.18; H, 8.84; N, 7.22; O, 8.25; S, 5.51 |
| CAS # | 1429749-41-6 |
| Related CAS # | 1429749-41-6 |
| PubChem CID | 126843233 |
| Appearance | White to off-white solid powder |
| LogP | 9.6 |
| Hydrogen Bond Donor Count | 3 |
| Hydrogen Bond Acceptor Count | 4 |
| Rotatable Bond Count | 23 |
| Heavy Atom Count | 41 |
| Complexity | 693 |
| Defined Atom Stereocenter Count | 1 |
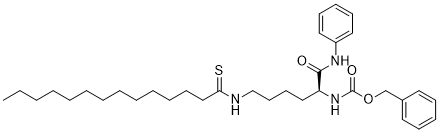
| SMILES | CCCCCCCCCCCCCC(=S)NCCCC[C@@H](C(=O)NC1=CC=CC=C1)NC(=O)OCC2=CC=CC=C2 |
| InChi Key | CJQGLLUJIVNREL-HKBQPEDESA-N |
| InChi Code | InChI=1S/C34H51N3O3S/c1-2-3-4-5-6-7-8-9-10-11-18-26-32(41)35-27-20-19-25-31(33(38)36-30-23-16-13-17-24-30)37-34(39)40-28-29-21-14-12-15-22-29/h12-17,21-24,31H,2-11,18-20,25-28H2,1H3,(H,35,41)(H,36,38)(H,37,39)/t31-/m0/s1 |
| Chemical Name | benzyl N-[(2S)-1-anilino-1-oxo-6-(tetradecanethioylamino)hexan-2-yl]carbamate |
| Synonyms | TM; Thiomyristoyl; 1429749-41-6; CHEMBL4129995; benzyl N-[(2S)-1-anilino-1-oxo-6-(tetradecanethioylamino)hexan-2-yl]carbamate; N-[(1S)-1-[(Phenylamino)carbonyl]-5-[(1-thioxotetradecyl)amino]pentyl]-carbamicAcidPhenylmethylEster; benzyl (S)-(1-oxo-1-(phenylamino)-6-tetradecanethioamidohexan-2-yl)carbamate; Thiomyristoyl?; MFCD30738003; Thiomyristoyl |
| HS Tariff Code | 2934.99.9001 |
| Storage |
Powder-20°C 3 years 4°C 2 years In solvent -80°C 6 months -20°C 1 month |
| Shipping Condition | Room temperature (This product is stable at ambient temperature for a few days during ordinary shipping and time spent in Customs) |
Biological Activity
| Targets | SIRT2 ( IC50 = 28 nM ); SIRT1 ( IC50 = 98 μM ) | |
| ln Vitro |
|
|
| ln Vivo |
Thiomyristoyl (TM) suppresses the growth of tumors in mouse models of breast cancer. TM does not significantly harm mice, and it does not cause any appreciable weight loss in mice receiving TM treatment. When comparing the tumors from TM-treated mice to those from vehicle-treated mice, the level of acetyl-a-tubulin is moderately but statistically significantly higher in S5H, indicating that TM does, in fact, inhibit SIRT2 in vivo[1]. Thiomyristoyl (TM) inhibits tumor growth in mouse models of breast cancer [1] To further demonstrate that SIRT2 inhibition can be useful for treating cancers, we tested Thiomyristoyl (TM) in two mouse models of cancer. The first was a xenograft model in which the triple-negative breast cancer cell line, MDA-MB-231, was injected subcutaneously into immunocompromised mice. When tumor size reached ~200 mm3, the mice were divided into two groups and treated by either direct intratumor (IT) (Figure S5) or intraperitoneal (IP) (Figure 5) injection of the control vehicle solvent (DMSO) or TM (1.5 mg TM in 50 µL DMSO; n = 5) daily. Tumors were collected after 30-days of treatment and analyzed. TM treatment significantly inhibited tumor growth as compared to the control (Figure S5A, S5B, and 5A). Histopathological examination revealed central areas of necrosis in tumors from both DMSO and TM treated mice, but the necrosis was more extensive and the overall tumor size was smaller in the TM treated mice (Figures S5D and 5C). IT TM injection showed a stronger effect in reducing tumor volume and increasing areas of necrosis as compared to IP TM injection. Analysis of TM content in tissue samples from TM-treated mice showed that IP-administered TM reached the tumors, even though the serum concentration of TM was low and a significant amount of TM accumulated in abdominal fat (Figure 5D). TM did not cause significant toxicity in mice (one mouse from each treatment group died, likely due to infection caused by repeated IP injection but not due to TM toxicity) and no significant weight loss was observed in TM-treated mice (Figure S5C and 5B). Immunohistochemistry staining of Ki-67 was performed to assess the effect of TM on the proliferation of tumor cells in vivo. As shown Figure 5E (upper panel) and 5F, as well as Figure S5F (upper panel) and S5G, a significant decrease in Ki-67+ cells was observed with TM treatment relative to vehicle treatment. To determine whether TM inhibits SIRT2 in vivo, we performed immunofluorescence staining of acetyl-α-tubulin in the xenograft tumors. As shown in Figure 5E (lower panel) and 5G, and Figure S5F (lower panel) and S5H, the acetyl-α-tubulin level was moderately but statistically significantly increased in tumors from TM treated mice compared with those from vehicle-treated mice, suggesting that TM indeed inhibits SIRT2 in vivo. The second mouse model was the mammary tumor model driven by mammary gland-specific expression of polyoma middle T antigen under the control of mouse mammary tumor virus promoter/enhancer (MMTV-PyMT model) (Guy et al., 1992). The MMTV-PyMT mice received daily IP injections with either the control vehicle solvent (DMSO) or Thiomyristoyl (TM) (1.5 mg TM in 50 µL DMSO; n = 10). The Kaplan-Meier tumor-free survival curve showed that TM treatment significantly prolonged the tumor-free survival of mice compared with vehicle-treated mice (Figure 6A). While the average time to tumor onset in the control group was 48 days, the mean latency for TM-treated mice was 54 days. Histopathological examination revealed more extensive areas of necrosis in the neoplasms from TM-treated mice as compared to the control group (Figure 6B). A significant decrease in proliferation of tumor cells was observed with TM treatment relative to vehicle treatment as measured by Ki-67 staining (Figure 6C, upper panel, and 6D). A modest but statistically significant increase in the acetyl-α-tubulin level was observed in tumors from TM-treated mice compared to those from vehicle-treated mice (Figure 6C, lower panel, and 6E), indicating that SIRT2 was inhibited by TM in vivo. The data demonstrate that SIRT2 inhibition with TM delays tumor onset in the MMTV-PyMT model and reduces tumor growth in vivo. |
|
| Enzyme Assay |
Inhibition assay for SIRT1, SIRT2, SIRT3, SIRT5. [1] Different concentrations (0.0064, 0.032, 0.16, 0.8, 4.0, 20, 100 and 200 μM) of TA~Thiomyristoyl (TM), and M were pre-incubated with 0.1 μM of SIRT1, 0.2 μM of SIRT2, 1 μM of SIRT3 or 1 μM of SIRT5, respectively, and 1 mM NAD in 20 mM Tris-HCl buffer (pH 8.0) with 1 mM dithiothreitol (DTT) at 37 °C for 15 min. Then 10 μM of acyl peptide (acetyl-H3K9 for SIRT1, SIRT2 and SIRT3; succinyl-H3K9 for SIRT5) was added to initiate the reactions. Then reactions were incubated at 37°C in a total volume of 60 μL (5 min for SIRT1, 5 min for SIRT2, 20 min for SIRT3, and 10 min for SIRT5). The reactions were stopped by adding 60 μL of an aqueous solution of 50% methanol containing 200 mM HCl and 320 mM acetic acid. After quenching the sirtuin reactions, centrifugation was used to remove precipitated proteins and the supernatant was analyzed by HPLC with a reverse phase C18 column (Kinetex XB-C18 100A, 100 mm × 4.60 mm, 2.6 μm, Phenomenex) with a gradient of 0 % in 2 min, 0% to 20% in 2min, 20% to 40% B in 13 min and then 40% to 100% for 2 min at 0.5 mL/min. Product quantification was based on the area of absorbance monitored at 280 nm. The peak areas were integrated and the conversion rate was calculated from the peak areas as the fraction of the free H3K9 peptide from the total peptide. Determination of kinetic parameters for Thiomyristoyl (TM). [1] For SIRT2 inhibition kinetics of Thiomyristoyl (TM), a mixture of acetyl-H3K9 (acH3K9) peptide substrate (2.5, 5, 10, 25, 50, 100, 187.5 μM), NAD (25, 50, 100, 250, 500, 1000, 1500 μM), TM (0, 0.01, 0.03, 0.1, and 0.3 μM), 20 mM Tris-HCl (pH 8.0) and 1 mM DTT was incubated at 37 °C. 1 mM NAD was used for determining the kinetic parameters for acH3K9 peptide, 100 μM of acH3K9 peptide was used for the determination of kinetic parameters for NAD. The reaction was started by adding 0.2 μM of SIRT2, and stopped after 5 min by adding 60 μL of an aqueous solution of 50% methanol containing 200 mM HCl and 320 mM acetic acid. The samples were analyzed by HPLC as described above and the initial velocity was calculated. The Km and vmax were obtained from Michaelie-Menten plots using Graphpad Prism software. Inhibition assay for SIRT6. [1] Different concentrations (0.0125, 0.05, 0.2, 0.8, 3.2, 12.8, 51.2, 204.8 μM) of TA~Thiomyristoyl (TM) were pre-incubated with 1 μM of SIRT6 and 1 mM NAD in 20 mM Tris-HCl buffer (pH 8.0) with 1 mM DTT at 37°C for 20 min. Then 50 μM of myristoyl-H3K9 peptide (myrH3K9) was added to initiate the reactions. The reactions were incubated at 37 °C in a total volume of 60 μL for 1 hr. The reactions were stopped by adding 60 μL of an aqueous solution of 50% methanol containing 200 mM HCl and 320 mM acetic acid. Inhibition assay for SIRT7. [1] Different concentrations (0.0125, 0.05, 0.2, 0.8, 3.2, 12.8, 51.2, 204.8 μM) of TA~Thiomyristoyl (TM) were pre-incubated with 1 μM of SIRT7 and 1 mM NAD in 150mM NaCl and 50 mM KH2PO4 buffer (pH 8.0) with 1 mM DTT at 37°C for 20 min. Then 10 μM myrH3K9 peptide and 0.083mg/mL tRNA were added to initiate the reactions. Then reactions were incubated at 37 °C in a total volume of 60 μL for 110 min. The reactions were stopped by adding 60 μL of an aqueous solution of 50% methanol containing 200 mM HCl and 320 mM acetic acid. |
|
| Cell Assay |
Three thousand to four thousand cells are seeded into each well of 96-well plates. The cells are treated with test compounds (Thiomyristoyl) at final concentrations ranging from 1 to 50 μM after a 24-hour period. Following a 72-hour incubation period, the CellTiter-Blue viability assay is used to determine the viability of the cells. Background subtraction is used to normalize relative cell viability in the presence of test compounds to the vehicle-treated controls. The IC50 values are found using GraphPad Prism software. Lentivral infection is used to knockdown SIRT1-7 in a variety of cell lines[1]. Soft agar colony formation assay. [1] For colony formation in semisolid medium, 1.0 × 10⁴ cells were plated in 0.3% low-melting point agarose onto 6-well plate coated with 1.2% LMP mixed with 2 × complete medium. For treatments, 2 × inhibitor was added to cells at the time of plating. The medium and inhibitor were replaced with fresh ones every 3 days. For colony formation of the SIRT2 KD cells, cells were transfected with the scrambled siRNA or SIRT2 siRNAs for 48 hr before plating in 6-well plate. Similarly, cell media was replaced every 3 days. After 14 days of incubation, colonies were photographed and counted with ImageJ. Biotin-Thiomyristoyl (TM)/M pull-down assay. [1] HEK293T cells were collected and lysed in lysis buffer containing 25 mM Tris, pH 7.4, 150 mM NaCl, 10% glycerol, 1% Nonidet P-40 and 1 × protease inhibitor cocktai. The cell extract supernatant was collected after centrifugation at 14,000 g for 20 min at 4 °C. Cell lysates were incubated with 10 μM Biotin-Thiomyristoyl (TM) or Biotin-M in the absence or presence of 1 mM NAD at 4 °C for 1 hr. The high capacity streptavidin resin was added to the mixture and incubated at 4 °C for another 1 hr. After centrifugation at 500 g for 2 min at 4 °C, the streptavidin resin was washed 3 times with 1 mL washing buffer (25 mM Tris, pH 7.4, 150 mM NaCl, 10% glycerol, 0.2% Nonidet P-40). The resinbound proteins were then separated with SDS-PAGE and immunoblotted with anti-SIRT1 or antiSIRT2 antibodies. To assess the binding of Thiomyristoyl (TM) to SIRT2 in cells, MCF-7 parental cells, Luciferase KD and SIRT2 KD cells were treated with 50 μM D-Biotin or Biotin-Thiomyristoyl (TM) as indicated for 6 hr and then lysed in lysis buffer containing 1 mM NAD. Cell extract was collected, streptavidin pull-down and western blot analysis was performed as described above. SIRT1 inhibition in cells. [1] MCF-7 or MDA-MB-468 cells were treated with indicated test compounds in the presence of 200 nM TSA for 6 hr. The acetylation level of p53 protein was determined by western blot using anti-acetyl-p53 (K382) antibody. β-actin served as a loading control. SIRT2 inhibition in cells. [1] MCF-7 cells were treated with indicated inhibitors at for 6 hr after 19 being transfected with pCMV-tag-4a-SIRT2 for 18 hr. Cells were collected and lysed in lysis buffer containing 25 mM Tris, pH 7.4, 150 mM NaCl, 10% glycerol, 4 mM MgCl2, 0.2 mM DTT, 100 mM NAD, 1% Nonidet P-40 and 1 × protease inhibitor cocktail. And the cell lysates were subjected to western blot for the analysis of acetyl-α-tubulin (K40) and α-tubulin levels. |
|
| Animal Protocol |
Mouse xenograft model 1.5 mg/50 μL (IP); 0.75 mg/50 μL (IT) intraperitoneal (IP) or intra-tumor (IT) injections Thiomyristoyl (TM) treatment of mice bearing human breast cancer xenotransplants. [1] Two million MDAMB-231 cells suspended in 100 μL 1 × PBS and 100 μL Matrigel were injected subcutaneously on the flanks of female Ncr Nu/Nu mice. Following the injections, mice were permitted to recover and monitored biweekly, including tumor measurement using calipers. Once the majority of tumors reached a threshold size of 200 mm3 , mice with intraperitoneal (IP) or intra-tumor (IT) injections of vehicle alone (DMSO) or inhibitor (Thiomyristoyl (TM) in DMSO) over one month. IP injections of 1.5 mg TM in 50 μL DMSO were given daily. IT injections of 0.75 mg TM in 50 μL DMSO per tumor were given 3 days per week. After one month of treatment or if mice met humane endpoint criteria, mice were euthanized by CO2 asphyxiation. Tissues were collected, fixed with 10% neutral-buffered formalin, embedded in paraffin, sectioned, and stained with hematoxylin and eosin (H&E). H&E-stained sections were scanned using an Aperio ScanScope and analyzed by a veterinarian certified in anatomic pathology by the American College of Veterinary Pathologists blinded to treatment group. Serum, tumor tissues and organs were snap frozen in liquid N2 and stored at -80 °C for subsequent analyses. Thiomyristoyl (TM) treatment of MMTV-PyMT mice. [1] MMTV-PyMT transgenic female mice on a pure FVB/N background were treated beginning at 6 weeks of age with daily IP injections of vehicle (DMSO) or 1.5 mg Thiomyristoyl (TM) in 50 μL DMSO over one month. Mice were monitored daily for tumor development and health status, and tumor size was measured twice per week. After one month of treatment or if mice met humane endpoint criteria, mice were euthanized by CO2 asphyxiation and necropsied. Tissues were collected and analyzed as described above. |
|
| References |
[1]. A SIRT2-Selective Inhibitor Promotes c-Myc Oncoprotein Degradation and Exhibits Broad Anticancer Activity. Cancer Cell. 2016 Mar 14;29(3):297-310. |
|
| Additional Infomation |
Targeting sirtuins for cancer treatment has been a topic of debate due to conflicting reports and lack of potent and specific inhibitors. We have developed a thiomyristoyl lysine compound, TM, as a potent SIRT2-specific inhibitor with a broad anticancer effect in various human cancer cells and mouse models of breast cancer. Mechanistically, SIRT2 inhibition promotes c-Myc ubiquitination and degradation. The anticancer effect of TM correlates with its ability to decrease c-Myc level. TM had limited effects on non-cancerous cells and tumor-free mice, suggesting that cancer cells have an increased dependency on SIRT2 that can be exploited for therapeutic benefit. Our studies demonstrate that SIRT2-selective inhibitors are promising anticancer agents and may represent a general strategy to target certain c-Myc-driven cancers. C-Myc is an important oncoprotein and is up-regulated in many human tumors. Thus, it has been considered as a promising cancer target. So far, no small molecules can directly target c-Myc in vivo. Recent studies showed that bromodomain inhibitors targeting BRD4 can suppress c-Myc transcription and inhibit tumorigenesis (Delmore et al., 2011). Our studies demonstrate that inhibiting SIRT2 offers a different way to target c-Myc. We show here that our SIRT2 inhibitor TM can effectively decrease the level of c-Myc in various cancer cell lines. Our data suggest that the ability of TM to decrease c-Myc abundance in different cell lines correlates with the sensitivity of the cell lines to TM. We further demonstrate here that decreasing c-Myc protein level is an important mechanism that accounts for hypersensitivity of certain cancer cell lines to TM. However, it should be pointed out that effects on other SIRT2-regulated pathways may also contribute to the activity of TM in cancer cells. This is especially true given that even cells without TM-induced c-Myc decrease (e.g. MDA-MB-231 and BT-549 cells) can still be inhibited by TM at higher concentrations. This also likely explains why c-Myc overexpression confers some but not complete resistance to TM (Figure 8C). We found that TM promotes the proteolytic degradation of c-Myc without affecting its transcription, which serves as an important but perhaps not the only mechanism by which TM destabilizes c-Myc. Aberrant translational control of the Myc oncoprotein has been implicated in many cancers (Chappell et al., 2000; Wolfe et al., 2014) and might also be involved in TM-induced reduction in c-Myc level. Our work establishes SIRT2 inhibition as a strategy to target the oncoprotein c-Myc, which is effective in many human cancer cell lines. Future detailed mechanistic investigations of the SIRT2/c-Myc regulatory pathway could potentially lead to the identification of additional therapeutic targets. [1] |
Solubility Data
| Solubility (In Vitro) |
|
|||
| Solubility (In Vivo) |
Solubility in Formulation 1: ≥ 2.5 mg/mL (4.30 mM) (saturation unknown) in 10% DMSO + 40% PEG300 + 5% Tween80 + 45% Saline (add these co-solvents sequentially from left to right, and one by one), clear solution. For example, if 1 mL of working solution is to be prepared, you can add 100 μL of 25.0 mg/mL clear DMSO stock solution to 400 μL PEG300 and mix evenly; then add 50 μL Tween-80 to the above solution and mix evenly; then add 450 μL normal saline to adjust the volume to 1 mL. Preparation of saline: Dissolve 0.9 g of sodium chloride in 100 mL ddH₂ O to obtain a clear solution. Solubility in Formulation 2: ≥ 2.5 mg/mL (4.30 mM) (saturation unknown) in 10% DMSO + 90% Corn Oil (add these co-solvents sequentially from left to right, and one by one), clear solution. For example, if 1 mL of working solution is to be prepared, you can add 100 μL of 25.0 mg/mL clear DMSO stock solution to 900 μL of corn oil and mix evenly. (Please use freshly prepared in vivo formulations for optimal results.) |
| Preparing Stock Solutions | 1 mg | 5 mg | 10 mg | |
| 1 mM | 1.7187 mL | 8.5933 mL | 17.1866 mL | |
| 5 mM | 0.3437 mL | 1.7187 mL | 3.4373 mL | |
| 10 mM | 0.1719 mL | 0.8593 mL | 1.7187 mL |