Physicochemical Properties
| Molecular Formula | C46H35N4O5PS |
| Molecular Weight | 786.83 |
| Exact Mass | 786.2065 |
| PubChem CID | 168264816 |
| Appearance | Typically exists as solid at room temperature |
| LogP | 9 |
| Hydrogen Bond Donor Count | 2 |
| Hydrogen Bond Acceptor Count | 10 |
| Rotatable Bond Count | 8 |
| Heavy Atom Count | 57 |
| Complexity | 1760 |
| Defined Atom Stereocenter Count | 0 |
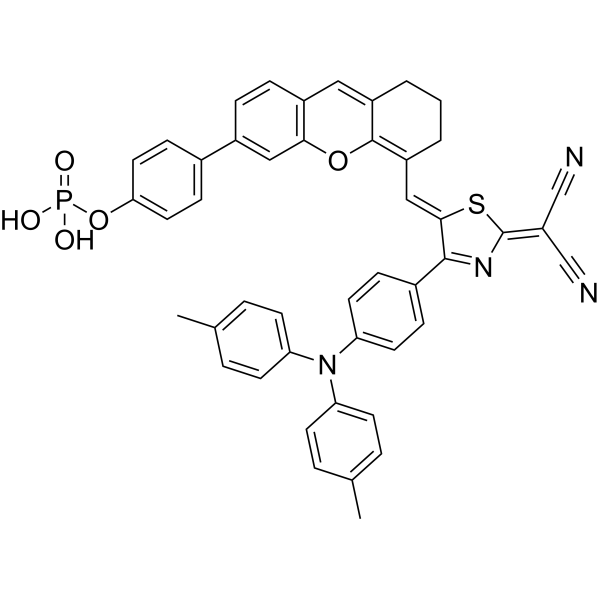
| SMILES | CC1=CC=C(C=C1)N(C2=CC=C(C=C2)C)C3=CC=C(C=C3)C\4=NC(=C(C#N)C#N)S/C4=C\C5=C6C(=CC7=C(O6)C=C(C=C7)C8=CC=C(C=C8)OP(=O)(O)O)CCC5 |
| InChi Key | VYRFSTARZNNQFU-SJUSNGENSA-N |
| InChi Code | InChI=1S/C46H35N4O5PS/c1-29-6-16-38(17-7-29)50(39-18-8-30(2)9-19-39)40-20-12-32(13-21-40)44-43(57-46(49-44)37(27-47)28-48)26-36-5-3-4-35-24-34-11-10-33(25-42(34)54-45(35)36)31-14-22-41(23-15-31)55-56(51,52)53/h6-26H,3-5H2,1-2H3,(H2,51,52,53)/b43-26- |
| Chemical Name | [4-[5-[(Z)-[2-(dicyanomethylidene)-4-[4-(4-methyl-N-(4-methylphenyl)anilino)phenyl]-1,3-thiazol-5-ylidene]methyl]-7,8-dihydro-6H-xanthen-3-yl]phenyl] dihydrogen phosphate |
| Synonyms | TTX-P; TTX P |
| HS Tariff Code | 2934.99.9001 |
| Storage |
Powder-20°C 3 years 4°C 2 years In solvent -80°C 6 months -20°C 1 month |
| Shipping Condition | Room temperature (This product is stable at ambient temperature for a few days during ordinary shipping and time spent in Customs) |
Biological Activity
| Targets | Fluorescent agent/probe |
| ln Vitro |
After reacting with alkaline phosphatase (ALP) at 10 μM, TTX-P produces an imaging-friendly NIR-II fluorescence signal at 920 nm [1]. ALP activity in cancer cells can be identified and tracked using TTX-P (10 μM; HepG2, 4T1, and LO2 cells) [1]. Response Mechanism and Selectivity of TTX-P toward ALP [1] According to the response mechanism of TTX-P toward ALP proposed in Scheme 1, via enzymatic reaction ALP cleaves the phosphate group of TTX-P, which results in the conversion of TTX-P to TTX-OH. In order to confirm this response mechanism, first, the absorption spectrum of TTX-OH in Tris-HCl buffer solution was measured, which was compared with the absorption spectrum of TTX-P after reaction with ALP (Figure 2A). Furthermore, the fluorescence spectra of TTX-OH and TTX-P after reaction with ALP were also compared (Figure 2B). The figures display that both TTX-OH and TTX-P after reaction with ALP in Tris-HCl buffer solution show almost identical absorption and emission spectra, suggesting that after reaction with ALP, TTX-P turns into TTX-OH. In addition, mass spectrometry analyses were also employed to confirm the probe’s response mechanism (Figure 2C). After TTX-P’s incomplete reaction with ALP, in the high-resolution mass spectrum there are two m/z peaks, the one at 787.2148 matches with TTX-P, and the other at 707.2450 matches with TTX-OH, indicating that after reaction with ALP, TTX-P transforms into TTX-OH. Moreover, HPLC experiments were conducted to check the response mechanism (Figure 2D). In the HPLC chromatogram, TTX-P itself displays the signal peak at 1.41 min. And TTX-OH displays the signal peak at 3.52 min. As for TTX-P undergoing incomplete reaction with ALP, the signal peak at 1.41 min (matching with TTX-P) decreases while the signal at 3.52 min (matching with TTX-OH) appears. Taken together the absorption and fluorescence spectra data as well as the HR mass spectrum data and the HPLC data show that, upon reaction with ALP, the probe TTX-P transforms into TTX-OH. In order to evaluate the selectivity of the probe TTX-P to ALP, various biologically relevant enzymes and substances (acetylcholinesterase (AchE), glutamyl transferase (GGT), carboxylesterase (CaE), cysteine (Cys), homocysteine (Hcy), glutathione (GSH), nitroreductase (NTR), H2O2, ascorbic acid (AA)) were employed in the experiment. As shown in Figure S12, except for ALP, the other enzymes or substances cannot lead to the enhancement of fluorescence. Additionally, the coexistence of these enzymes or substances will not affect the probe TTX-P’s response toward ALP (Figure S13). These results exhibit that the probe TTX-P has relatively good selectivity for ALP. In Vitro Cytotoxicity and Cell Imaging [1] Since previous researches demonstrated that ALP is highly expressed in human hepatocellular carcinomas cells (HepG2) and mouse breast cancer cells (4T1), HepG2 and 4T1 cells were selected for the intracellular imaging experiments. In addition, human liver cell line (LO2) was used for comparison, owing to the little expression of ALP in this cell line.51−53 Before cell imaging, the cytotoxicity of TTX-P to different cell lines was evaluated by the MTT method. As shown in Figure 3A, when the probe concentration is 40 μM, the cell viability is still higher than 85%. This indicates that TTX-P has relatively low cytotoxicity. Next, these cell lines were employed to evaluate the intracellular imaging capability of the probe TTX-P for ALP. As shown in Figure 3B, the HepG2, 4T1, and LO2 cells not treated by TTX-P (Control) exhibit almost no fluorescent signals. Whereas, after the incubation of the HepG2 and 4T1 cells with TTX-P, obvious fluorescence can be observed, which is caused by the presence of ALP in the HepG2 and 4T1 cells. On the contrary, LO2 cells display little fluorescence even after the cells’ incubation with the probe TTX-P, probably due to the low expression of ALP in LO2 cells. In order to further confirm that the fluorescent signals in the HepG2 and 4T1 cells are activated by endogenous ALP, these cells were first pretreated with Na3VO4 (ALP inhibitor), and then treated with TTX-P. As expected, only weak fluorescent signals can be observed in these cells. The above experimental data indicate that the probe TTX-P can detect and monitor the activity of ALP in cancer cells. |
| ln Vivo |
The intratumoral injection of TTX-P (5 mg/kg) in 4T1 cell xenograft BALB/C nude mice allows for the detection and tracking of endogenous alkaline phosphatase activity in vivo [1].
Imaging of Subcutaneous Tumors in Mouse Model [1] After it was confirmed that the probe TTX-P could be used in intracellular detection and imaging of ALP, we further evaluated the probe TTX-P’s capability for in vivo detection and imaging of ALP in tumors in mice. There are no obvious changes in the absorbance of TTX-P after incubation with fetal bovine serum (Figure S14), indicating the probe TTX-P’s good stability in a biological environment. The biosafety of TTX-P was assessed before conducting in vivo imaging experiments. In order to assess the toxicity of TTX-P in vivo, the main organs of mice in the “Saline” group (i.e., healthy mice being injected with saline intravenously through the tail vein) and the “TTX-P” group (i.e., healthy mice being injected with TTX-P through the tail vein) were analyzed by H&E staining analyses. As shown in Figure S15, no obvious signs of abnormal morphologies are observable, which indicates that TTX-P has relatively good biosafety. Since ALP is overexpressed in 4T1 tumors, the 4T1 subcutaneous tumor mouse model was established to evaluate in vivo ALP imaging by the probe.47 BALB/C nude mice were adopted to establish 4T1 subcutaneous tumor mouse model according to the reported method. And 4T1 cells were subcutaneously injected into right hind limb of the mice to establish the subcutaneous tumor model. In the imaging experiment, the mice were allocated into 3 groups. Among them, one group consisting of healthy mice received no treatment (referred to as the “Control “ group). The subcutaneous tumor model group that received injection of the probe was referred to as the “TTX-P” group, and the subcutaneous tumor model group that received injection of Na3VO4 and the probe was referred to as the “TTX-P + Na3VO4” group. The TTX-P group received intratumoral injection of TTX-P (5 mg·kg–1, in PBS containing 5% DMSO). While the TTX-P + Na3VO4 received intratumoral injection of Na3VO4 (2.25 mg·kg–1), and 30 min later an intratumoral injection of TTX-P was given. After intratumoral injection of the probe TTX-P, significant enhancement of NIR-II fluorescence signals can be observed over time in the tumor region in the TTX-P groups (Figure 4A,B, and Figure S16). For the TTX-P + Na3VO4 group, no obvious fluorescent signals can be found after injection of the probe. As shown in Figure 4C, the imaging data for the dissected tumors are consistent with the results of in vivo imaging. The above results indicate that TTX-P has the ability to detect and monitor the activity of endogenous ALP in vivo. Imaging of Diabetic Liver Injury in Mouse Model [1] After the probe TTX-P was confirmed to be able to detect and image ALP in tumors in vivo, the probe TTX-P’s detection and imaging ability for the in situ ALP in diabetic liver injury in mice was evaluated. Kunming mice (KM mice) are an experimental mouse strain derived from Swiss mice and characterized by high disease resistance and widely used in biological imaging studies In addition, the streptozotocin (STZ)-induced diabetes model in Kunming mouse has been extensively used in the study of diabetes.59,60 Hence, in this experiment, we adopted Kunming mice for establishing the diabetes mouse model. First, the diabetes mouse model was obtained by intraperitoneal injection of streptozotocin (Figure S17), as an analog of N-acetylglucosamine, which is a specific toxin aimed at the pancreas β Cell. In order to confirm the liver injury in diabetic mice, the liver tissue sections’ histological analyses (H&E staining) were carried out for different groups of mice (Figure 5A), namely, healthy mice received no treatment (Control), diabetic mice (Diabetic), the treatment group (Diabetic + Met) consists of diabetic mice treated with metformin, which in clinical practice is used as an oral hypoglycemic drug for diabetes treatment and has a protective effect on the organs of streptozotocin-induced diabetes.63−65 As for the control group mice, the morphology of the liver tissue sections appears normal. While, for the diabetes group of mice, the liver tissue sections show vacuolization in hepatocytes and hepatocellular watery degeneration. And the morphology of the liver tissue sections of the treatment group is much improved and is closer to the control compared to the diabetes group. Next, NIR-II imaging experiments were conducted for the different groups of mice. In the Control group, healthy mice were injected with TTX-P through the tail vein. For the Diabetic + TTX-P group, diabetic mice were injected with TTX-P through the tail vein, while for the Diabetic + Met + TTX-P group, the diabetic mice were injected with TTX-P after metformin treatment orally for 7 days. As shown in Figure 5B,C and Figure S18, after TTX-P was injected into the tail vein of the mice, there were weak fluorescence signals in the liver region of the control group (healthy mice) which increased slowly over time; this is because in the liver of healthy mice there exists a relatively low level of ALP. As for the diabetic mice after probe injection (Diabetic + TTX-P), the fluorescence signals in the liver region are significantly stronger than that of the control, indicating that the ALP level is significantly upregulated in the liver of diabetic mice. As for the diabetic mice treated with metformin (Diabetic + Met + TTX-P), the fluorescence signals in the mice’s liver area significantly diminish, indicating that the ALP expression is down-regulated upon the mice receiving the treatment. Afterward, the main organs were dissected from the mice and underwent NIR-II fluorescence imaging. As shown in Figure 5D, the fluorescence signals in the liver in diabetes mice (Diabetic + TTX-P) are relatively stronger compared to the signals in the control group (healthy mice). Compared with diabetes mice without undergoing treatment (Diabetic + TTX-P), the fluorescence signals in the liver of the treatment group (Diabetic + Met + TTX-P) are much weaker. These imaging results corroborate that the probe TTX-P can be employed to detect and image diabetic liver injury via monitoring ALP in the liver with in situ NIR-II fluorescence imaging. |
| Enzyme Assay |
Spectral response of the probe in buffer solution [1] TTX-P was dissolved in DMSO to prepare the stock solution and diluted with TRIS-HCl (pH = 8.0) solution to prepare a final concentration of 10 μM (containing 5% DMSO), and then the absorption and emission spectra measurements were conducted. Different amounts of ALP were added into the TRIS-HCl (pH = 8.0) solution of TTX-P, the fluorescence changes of TTX-P were recorded at different time points (the excitation wavelength is 808 nm, and collect the emission signals from 900 nm to 1400 nm). In the time course experiment and the selectivity experiment, ALP or/and other enzymes or substances were added to the TRIS-HCl solution of the probe for a certain period of time, and then fluorescence intensity was measured. The detection limits were calculated by the literature-reported 3σ/k method, where σ represents the standard deviation of the 6 blank measurements. The FL intensities at 920 nm were plotted to the concentrations of ALP, and a linear correlation in the range of 0-0.4 U∙L−1 of ALP was acquired, from which the slope k was obtained. Optical stability in serum [1] S7 The probe’s stability in serum was evaluated according to the literature-reported method. TTX-P was first dissolved in DMSO to prepare the stock solution, which was then diluted with fetal bovine serum to obtain a final concentration of 10 μM (containing 5% DMSO). After the solutions underwent incubation at 37℃ for different time, absorption spectra measurements were conducted. The stability of TTX-P was investigated by comparing the initial absorption values and the absorption values after incubation with serum for different time of TTX-P at 778 nm. |
| Cell Assay |
Cytotoxicity and cell imaging [1] Human hepatoellular carcinomas (HepG2 cells), mouse breast cancer cells (4T1 cells) and human normal hepatocytes (LO2 cells) were obtained from KeyGen Biology Co. Ltd (Nanjing, China). HepG2 cells were cultured in DMEM supplemented with 10% FBS, 1% penicillin and streptomycin at 37°C in 5% CO2 atmosphere. 4T1 and LO2 cells were cultured in RPMI-1640 supplemented with 10% FBS, 1% penicillin and streptomycin at 37°C in 5% CO2 atmosphere. The viabilities of HepG2, 4T1 and LO2 cells that were or were not exposed to TTP-X were evaluated by MTT assay. In general, the cells were seeded in 96-well plates (5000 cells/well). After 12h, the cells were incubated with different concentrations of TTX-P (0, 2.5, 5, 10, 20 and 40 μM) in the medium for another 24 h. Then, the fresh medium containing 0.5 mg·mL−1 MTT was added to each well of the assay plate and incubated for additional 4 h. Finally, the medium was discarded, the cells were washed three times with PBS and DMSO (150 μL) was added. The absorbance was measured with a Thermo MK3 ELISA reader at 570 nm to estimate the viability of cells. For cell imaging, HepG2, 4T1 and LO2 cells were seeded in a 96-well plate to adhere. After 12 h, the cells in the "TTX-P" group were incubated in culture medium containing 10 µM of TTX-P at 37°C under 5% CO2 for 1 h. The cells in the "TTX-P + Na3VO4" group were treated with culture medium containing the inhibitor Na3VO4 (10 mM) for 30 minutes in advance then 10 µM TTX-P was added. The cells in the "Control" group were treated with saline for 1 h. After incubation, the cells were S8 washed with PBS three times before subjected to fluorescence imaging. |
| Animal Protocol |
Animal/Disease Models: BALB/C nude mice with 4T1 cells xenografts (female, 4-5 weeks old)[1] Doses: 5 mg/kg Route of Administration: Intratumoral injection Experimental Results: Enhanced NIR-II fluorescence signals in a time-dependent manner. Imaging of 4T1 subcutaneous tumor mouse model [1] The 4-5 weeks old nude BALB/c mice were subcutaneously injected with 4T1 cells (2 106 cells per mice) in the right hind limb of the mice for 14 days to establish the subcutaneous tumor mouse model (n = 5 per group). 4T1 subcutaneous tumor-bearing mice were randomly divided into 3 groups (Control group, TTX-P group and TTX-P + Na3VO4 group, n = 5). For "Control" group, the healthy mice received no treatment. For "TTX-P" group, mice are intratumorally injected with TTX-P (5 mg•kg−1 , dissolved in PBS containing 5% DMSO). For "TTX-P + Na3VO4 " group, mice received intratumoral injection of Na3VO4 (2.25 mg•kg−1), and 30 min later a intratumoral injection of TTX-P (5 mg•kg−1, dissolved in PBS containing 5% DMSO) was given. The mice were placed in prone position, 1% isoflurane was delivered with nose cone for mouse anesthesia. The excitation light was provided by an 808 nm laser S9 with a power density at the imaging plane of 80 mW cm-2 for in vivo NIR-II fluorescent imaging. Imaging of diabetic liver injury in mouse model [1] All KM mice were randomly divided into three groups. For the "Control" group, the healthy mice were injected TTX-P (5 mg kg−1 BW) via tail vein. For the "diabetic + TTX-P" and the "diabetic + Met + TTX-P" group, diabetic model mice were used. To establish the diabetic model, mice was intraperitoneally injected with 150 mg•kg−1 body weight (BW) of streptozotocin (STZ) fresh dissolved in 0.01 M citric acid buffer (pH 4.5). After 3 days, the average blood glucose level of mice was > 16.7 mmol/L, indicating that the diabetes mouse model was successfully established. For the "diabetic + TTX-P " group, the diabetic mice were injected TTX-P (5 mg kg−1 BW) via tail vein. For the "diabetic +Met + TTX-P" group, mice were treated with metformin (200 mg kg−1 BW) orally for 7 days followed by intravenous injection of TTX-P (5 mg kg−1 BW). The mice were in supine position and anesthetized with 1% isoflurane inhalation through nasal cone. In vivo near-infrared-II fluorescence imaging was performed using 808 nm laser with power density of 80 mW cm-2 . |
| References |
[1]. Visualizing Detection of Diabetic Liver Injury by a Biomarker-Activatable Probe via NIR-II Fluorescence Imaging. Chem Biomed Imaging. 2023 Apr 20;1(8):716-724. |
| Additional Infomation |
Diabetes characterized by hyperglycemia is a chronic metabolic disease with increasing prevalence worldwide, and over time it leads to damage to various organs including the liver. As the liver is the major organ for glucose metabolism, patients with diabetes are prone to liver injuries or damages; and without timely and effective treatment, diabetic liver injury may further deteriorate into serious or life-threatening complications including liver cancer or liver failure. Hence, the accurate detection of diabetic liver injury is of great significance for diabetic patients in terms of improving quality of life. Herein, a fluorescent probe (TTX-P) has been developed for in situ detection and imaging of diabetic liver injury in the near-infrared second-window (NIR-II) region. In routine clinical practice, alkaline phosphatase (ALP) is one of the most commonly assayed enzymes, and thus serving as an important diagnostic biomarker for liver dysfunction or injury. The probe TTX-P responds in situ to the overexpressed ALP in liver and thus giving out strong NIR-II fluorescence as the reporting signals for detection and imaging. The NIR-II probe TTX-P consists of the NIR-II chromophore TTX-OH as the fluorophore and phosphate group as the responsive unit. Without the presence of ALP, the probe TTX-P displays weak fluorescence because the electron-withdrawing phosphate group weakens the electron-pushing capability of the electron-donor side of the NIR-II fluorophore. While in the presence of ALP, the phosphate group is cleaved by the enzyme and consequently the fluorophore emits evident NIR-II fluorescence. The probe TTX-P has been applied in imaging liver injury in diabetic mice. The approach provides a utilitarian means for visualizing detection of diabetic liver injury in mice with NIR-II fluorescence imaging. In summary, we have developed a probe for detecting and imaging diabetic liver injury via monitoring in situ hepatic ALP through NIR-II fluorescent imaging in a visualizing manner. The probe has relatively good biosafety and exhibits good selectivity toward ALP, and the probe TTX-P can be triggered by the biomarker ALP in situ in the liver and thus give out salient NIR-II fluorescence signals for detection and imaging. Therefore, the probe can serve as a utilitarian tool for detecting diabetic liver injury via monitoring in situ hepatic ALP. The approach herein could provide helpful information for the design of other NIR-II probes for visualizing biomarker-triggered detection/imaging of other diseases.[1] |
Solubility Data
| Solubility (In Vitro) | May dissolve in DMSO (in most cases), if not, try other solvents such as H2O, Ethanol, or DMF with a minute amount of products to avoid loss of samples |
| Solubility (In Vivo) |
Note: Listed below are some common formulations that may be used to formulate products with low water solubility (e.g. < 1 mg/mL), you may test these formulations using a minute amount of products to avoid loss of samples. Injection Formulations (e.g. IP/IV/IM/SC) Injection Formulation 1: DMSO : Tween 80: Saline = 10 : 5 : 85 (i.e. 100 μL DMSO stock solution → 50 μL Tween 80 → 850 μL Saline) *Preparation of saline: Dissolve 0.9 g of sodium chloride in 100 mL ddH ₂ O to obtain a clear solution. Injection Formulation 2: DMSO : PEG300 :Tween 80 : Saline = 10 : 40 : 5 : 45 (i.e. 100 μL DMSO → 400 μLPEG300 → 50 μL Tween 80 → 450 μL Saline) Injection Formulation 3: DMSO : Corn oil = 10 : 90 (i.e. 100 μL DMSO → 900 μL Corn oil) Example: Take the Injection Formulation 3 (DMSO : Corn oil = 10 : 90) as an example, if 1 mL of 2.5 mg/mL working solution is to be prepared, you can take 100 μL 25 mg/mL DMSO stock solution and add to 900 μL corn oil, mix well to obtain a clear or suspension solution (2.5 mg/mL, ready for use in animals). Injection Formulation 4: DMSO : 20% SBE-β-CD in saline = 10 : 90 [i.e. 100 μL DMSO → 900 μL (20% SBE-β-CD in saline)] *Preparation of 20% SBE-β-CD in Saline (4°C,1 week): Dissolve 2 g SBE-β-CD in 10 mL saline to obtain a clear solution. Injection Formulation 5: 2-Hydroxypropyl-β-cyclodextrin : Saline = 50 : 50 (i.e. 500 μL 2-Hydroxypropyl-β-cyclodextrin → 500 μL Saline) Injection Formulation 6: DMSO : PEG300 : castor oil : Saline = 5 : 10 : 20 : 65 (i.e. 50 μL DMSO → 100 μLPEG300 → 200 μL castor oil → 650 μL Saline) Injection Formulation 7: Ethanol : Cremophor : Saline = 10: 10 : 80 (i.e. 100 μL Ethanol → 100 μL Cremophor → 800 μL Saline) Injection Formulation 8: Dissolve in Cremophor/Ethanol (50 : 50), then diluted by Saline Injection Formulation 9: EtOH : Corn oil = 10 : 90 (i.e. 100 μL EtOH → 900 μL Corn oil) Injection Formulation 10: EtOH : PEG300:Tween 80 : Saline = 10 : 40 : 5 : 45 (i.e. 100 μL EtOH → 400 μLPEG300 → 50 μL Tween 80 → 450 μL Saline) Oral Formulations Oral Formulation 1: Suspend in 0.5% CMC Na (carboxymethylcellulose sodium) Oral Formulation 2: Suspend in 0.5% Carboxymethyl cellulose Example: Take the Oral Formulation 1 (Suspend in 0.5% CMC Na) as an example, if 100 mL of 2.5 mg/mL working solution is to be prepared, you can first prepare 0.5% CMC Na solution by measuring 0.5 g CMC Na and dissolve it in 100 mL ddH2O to obtain a clear solution; then add 250 mg of the product to 100 mL 0.5% CMC Na solution, to make the suspension solution (2.5 mg/mL, ready for use in animals). Oral Formulation 3: Dissolved in PEG400 Oral Formulation 4: Suspend in 0.2% Carboxymethyl cellulose Oral Formulation 5: Dissolve in 0.25% Tween 80 and 0.5% Carboxymethyl cellulose Oral Formulation 6: Mixing with food powders Note: Please be aware that the above formulations are for reference only. InvivoChem strongly recommends customers to read literature methods/protocols carefully before determining which formulation you should use for in vivo studies, as different compounds have different solubility properties and have to be formulated differently. (Please use freshly prepared in vivo formulations for optimal results.) |
| Preparing Stock Solutions | 1 mg | 5 mg | 10 mg | |
| 1 mM | 1.2709 mL | 6.3546 mL | 12.7092 mL | |
| 5 mM | 0.2542 mL | 1.2709 mL | 2.5418 mL | |
| 10 mM | 0.1271 mL | 0.6355 mL | 1.2709 mL |