SR17018 is an agonist of the μ-opioid-receptor (MOR) which binds to GTPγS with EC50 value of 97 nM. SR17018 demonstrates no discernible impact on triggering the recruitment of βarrestin2 to the MOR at concentrations lower than 10 μM. SR17018 facilitates signaling via G proteins or βarrestin2. G protein signaling bias extends the therapeutic window, permitting antinociception in the absence of respiratory suppression, whereas compounds biased toward βarrestin, like fentanyl, are more likely to cause respiratory suppression at low analgesic doses. There were greater variations in the compounds' capacity to cause βarrestin2 recruitment to the MOR. For example, SR-17018, did not show any noteworthy effectiveness in the βarrestin2 EFC assay until a concentration of 10 μM.
Physicochemical Properties
| Molecular Formula | C₁₉H₁₈CL₃N₃O | |
| Molecular Weight | 410.72 | |
| Exact Mass | 409.05 | |
| Elemental Analysis | C, 55.56; H, 4.42; Cl, 25.89; N, 10.23; O, 3.90 | |
| CAS # | 2134602-45-0 | |
| Related CAS # |
|
|
| PubChem CID | 130431397 | |
| Appearance | White to off-white solid powder | |
| LogP | 4.7 | |
| Hydrogen Bond Donor Count | 1 | |
| Hydrogen Bond Acceptor Count | 2 | |
| Rotatable Bond Count | 3 | |
| Heavy Atom Count | 26 | |
| Complexity | 506 | |
| Defined Atom Stereocenter Count | 0 | |
| InChi Key | LAGUDYUGRSQDKS-UHFFFAOYSA-N | |
| InChi Code | InChI=1S/C19H18Cl3N3O/c20-13-3-1-12(2-4-13)11-24-7-5-14(6-8-24)25-18-10-16(22)15(21)9-17(18)23-19(25)26/h1-4,9-10,14H,5-8,11H2,(H,23,26) | |
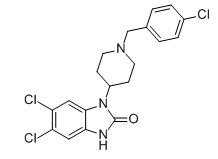
| Chemical Name | 5,6-dichloro-3-[1-[(4-chlorophenyl)methyl]piperidin-4-yl]-1H-benzimidazol-2-one | |
| Synonyms |
|
|
| HS Tariff Code | 2934.99.9001 | |
| Storage |
Powder-20°C 3 years 4°C 2 years In solvent -80°C 6 months -20°C 1 month |
|
| Shipping Condition | Room temperature (This product is stable at ambient temperature for a few days during ordinary shipping and time spent in Customs) |
Biological Activity
| Targets | MOR ( EC50 = 97 nM ) | ||
| ln Vitro |
|
||
| ln Vivo |
|
||
| Enzyme Assay |
A commercial enzyme fragment complementation assay (β-galactosidase) was utilized to ascertain the recruitment of βarrestin2 to the human MOR. Prior to measuring the signal, U2OS-βarrestin-hMOR PathHunter cells were plated in Assay Complete Cell Plating 5 Reagent in a 384-well, white-walled assay microplate at a density of 5,000 cells per well 16–20 hours earlier. βarrestin2 recruitment was assessed using the PathHunter Detection Kit with the β-galactosidase substrate to detect functional β-galactosidas after cells were treated for 90 minutes at 37°C with increasing concentrations of test compounds. A SpectraMax M5e Microplate Reader was used to measure the increase in luminescence that resulted. For the PathHunter U2OS OPRM1 βarrestin cells, the average vehicle was 446 ± 25 RLU, while the average fold over vehicle for DAMGO was 36 ± 1.
Saturation and competition radioligand binding [1] Receptor binding assays were performed on CHO-hMOR, CHO-hDOR and CHO-hKOR cell lines as previously described (Groer et al., 2011; Schmid et al., 2013). Cells were serum-starved for 30 minutes, cells were collected and membrane pellets were prepared by Teflon-on-glass dounce homogenization in membrane buffer containing (50 mM Tris-HCl, pH 7.4, 100 mM NaCl, 1 mM EDTA), followed by centrifugation at 20,000 x g for 30 minutes at 4 °C. Membranes were resuspended in assay buffer (10 mM Tris-HCl, pH 7.4, 100 mM NaCl). Binding reactions (200 μl volume) were performed on 10 μg membranes with the appropriate radioligand (MOR, 3H-DAMGO; KOR, 3H-U69,593; DOR, 3H-diprenorphine) for 2 hours at 25 °C. For competition experiments, the concentration of each of the radioligands was approximately 1 nM (0.96–1.10 nM 3H-DAMGO; 1.06–1.19 nM 3H-U69,593; 0.92–0.98 nM 3H-diprenorphine). Nonspecific binding was determined in the presence of 10 μM DAMGO (MOR), 10 μM U69,593 (KOR) or 10 μM Naloxone (DOR). Reactions were terminated by filtration through GF/B glass fiber filter plates, which had been pre-incubated with 0.1% polyethyleneimine, on a Brandel cell harvester. Radioactivity was counted with Microscint on a TopCount NXT Scintillation Counter. Saturation binding assays and hyperbolic curve fitting of specific binding was used to determine radioligand binding affinities and receptor numbers for the CHO cell lines (hMOR, 1.02 ± 0.10 nM for 3H-DAMGO and 1.58 ± 0.11 pmol/mg; hDOR, 0.70 ± 0.11 nM [3H]-Diprenorphine and 1.46 ± 0.26 pmol/mg; hKOR, 1.07 ± 0.01 nM [3H]-U69,593 and 0.71 ± 0.12 pmol/mg). 35S-GTPγS binding to membranes [1] 35S-GTPγS binding was determined in membranes prepared from CHO-hMOR and CHO-mMOR cells and brainstems isolated from adult male C57BL/6J and MOR-KO mice as described previously (Schmid et al., 2013). CHO-hMOR and CHO-mMOR cellular membranes, collected and prepared as described above with in GTPγS binding membrane buffer (10 mM Tris-HCl, pH 7.4, 100 mM NaCl, 1 mM EDTA). Reactions (200 μl volume) were performed for 1 hour at 25 °C on 10 μg membranes suspended in assay buffer (50 mM Tris-Cl, pH 7.4, 100 mM NaCl, 5 mM MgCl2, 1 mM EDTA) with 50 μM Guanosine-5”-diphosphate (GDP) and 0.1 nM 35S-GTPγS. Reactions were terminated by filtration through GF/B filter plates and radioactivity was counted as described above. For [35S]-GTPγS binding on brainstems isolated from C57BL/6J and MOR-KO mice, tissues were homogenized by polytronic tissue tearor and membranes were prepared as described above. Binding reactions, containing 2.5 μg protein, 1 mM dithiothreitol (DTT), 20 μM GPD and 0.1 nM 35S-GTPγS, were incubated at room temperature for 2 hours prior to harvesting. The average vehicle value for the CHO-hMOR membranes was 786 ± 78 cpm and the average fold over vehicle for DAMGO was 4.6± 0.26. The average vehicle value for the CHO-mMOR cell membranes was 694 ± 28 cpm and the average fold over vehicle for DAMGO was 5.9 ± 0.57. The average vehicle for the C57BL/6J brainstem membranes was 657 ± 62 cpm and the average fold over vehicle for DAMGO was 1.9 ± 0.03. The average vehicle for the MOR-KO brainstem membranes was 1647 ± 507 cpm. βArrestin2 recruitment assays [1] To determine βarrestin2 recruitment to the human MOR a commercial enzyme fragment complementation assay (β-galactosidase) was used. U2OS-βarrestin-hMOR PathHunter® cells were plated at a density of 5,000 cells per well of a 384-well, white-walled assay microplate in Assay Complete Cell Plating 5 Reagent 16–20 hours prior to measuring the signal. Cells were treated for 90 minutes with increasing concentrations of test compounds at 37 °C and βarrestin2 recruitment was determined using the PathHunter® Detection Kit with the β-galactosidase substrate to detect functional β-galactosidas. The resulting increase in luminescence was measured using a SpectraMax M5e Microplate Reader. The average vehicle for the PathHunter U2OS OPRM1 βarrestin cells was 446 ± 25 RLU and the average fold over vehicle for DAMGO was 36 ± 1. To determine βarrestin2 recruitment to the mMOR, an imaging-based assay as was used (Zhou et al., 2013). U2OS-βarrestin2-GFP-mMOR cells were plated at a density of 5,000 cells per well of a 384-well, black-walled, clear-bottom optical imaging microplate (Brooks) in normal media 16–20 hours prior to assaying. Cells were serum-starved for 1 hour and then treated with increasing concentrations of test compounds for 20 minutes at 37 °C. Cells were fixed with 4% paraformaldehyde (PFA) containing Hoechst nuclear stain at a dilution of 1:1000. βArrestin 2 translocation was measured using the 20X objective on a CellInsight CX5 High Content Screening Platform. Punctae (normalized to Hoechst stain) were quantified using the Cellomics’ Spot Detection BioApplication. The average punctae / Hoechst ratio for vehicle treated U2OS-βarrestin2-GFP-mMOR cells was 2.2 ± 0.54 and the average fold over vehicle for DAMGO was 61 ± 13. To determine whether the compounds have activity at NOP, βarrestin2 recruitment to the receptor was determined in the U2OS-Tango-hOPRL1-bla cells. U2OS-Tango-hOPRL1-bla cells were plated at a density of 10,000 cells per well of a 384-well, black-walled, clear-bottom assay plate in 32 μl assay media (DMEM + 10% dialyzed FBS, 0.1 mM NEAA, 25 mM HEPES and 1% pen/strep) 16–20 hours prior to assaying. Cells were treated with increasing concentrations of test compounds for 5 hours at 37 °C. NOP activation was determined using the LiveBLAzer FRET-B/G loading kit with Solution D, according to the manufacturer’s protocol. FRET signal (excitation 409 nm, emissions at 460 nm and 530 nm) was measured using a SpectraMax M5e Microplate Reader. The average 460/530 ratio vehicle treated U2OS-Tango-hOPRL1-bla cells was 0.31 ± 0.03 and the average fold over vehicle for nociceptin was 7.6 ± 0.68. |
||
| Cell Assay |
cAMP accumumlation assay [1] The CHO-hMOR, -hDOR, and -hKOR cells were seeded at a density of 4,000 cells per well in Opti-MEM containing 1% FBS in a 384-well, white-walled, 30 μl-volume microplate (Greiner Bio-One) four hours before the assay. 20 μM forskolin, 25 μM 4-(3-Butoxy-4-methoxybenzyl)imidazolidin-2-one (Ro-20-1724), and escalating concentrations of test compounds were applied to the cells for 30 minutes at 25°C. Next, we used Cisbio's Homogeneous Time-Resolved Fluorescence resonance energy transfer (FRET) cAMP HiRange assay (Cisbio-62AM6PEC) to measure the inhibition of cAMP. At 620 and 665 nm, fluorescence was measured with a PerkinElmer Envision Multilabel Reader. The formula for calculating FRET was 665 nm / 620 nm. For CHO-hMOR cells, the average vehicle ratio was 3134 ± 99, while for DAMGO, the average fold over vehicle was 2.2 ± 0.04. For CHO-hDOR cells, the average vehicle ratio was 2962 ± 181, and for SNC80, the average fold over vehicle was 1.6 ± 0.04. For CHO-hKOR cells, the average vehicle ratio was 2965 ± 153, and for U69,593, the average fold over vehicle was 1.9 ± 0.12. |
||
| Animal Protocol |
|
||
| References |
[1]. Bias Factor and Therapeutic Window Correlate to Predict Safer Opioid Analgesics. Cell. 2017 Nov 16;171(5):1165-1175.e13. |
||
| Additional Infomation |
Biased agonism has been proposed as a means to separate desirable and adverse drug responses downstream of G protein-coupled receptor (GPCR) targets. Herein, we describe structural features of a series of mu-opioid-receptor (MOR)-selective agonists that preferentially activate receptors to couple to G proteins or to recruit βarrestin proteins. By comparing relative bias for MOR-mediated signaling in each pathway, we demonstrate a strong correlation between the respiratory suppression/antinociception therapeutic window in a series of compounds spanning a wide range of signaling bias. We find that βarrestin-biased compounds, such as fentanyl, are more likely to induce respiratory suppression at weak analgesic doses, while G protein signaling bias broadens the therapeutic window, allowing for antinociception in the absence of respiratory suppression.[1] With these limitations in mind, this study still remains the first of its kind to systematically assess a chemical series of agonists for bias across multiple signaling assays and to also perform thorough analyses of behavioral responses in a dose dependent manner. The demonstration of a correlation between the bias observed to the width of the therapeutic window is highly encouraging for using these signaling assays to predict favorable outcomes in the mouse models used here. Moreover, we have demonstrated that key regions of the chemical scaffold can be mindfully modified to direct signaling between the different assays in cell culture and that this recapitulates as differences in potencies in vivo. Finally, this study introduces a new series of G protein signaling biased MOR agonists that have the highest degree of separation between respiratory suppression and antinociception in rodent models reported to date. Our hope is that this work may aid the pharmaceutical development of safer alternatives to current opioid therapeutics.[1] |
Solubility Data
| Solubility (In Vitro) |
|
|||
| Solubility (In Vivo) |
Solubility in Formulation 1: ≥ 1.25 mg/mL (3.04 mM) (saturation unknown) in 10% DMSO + 40% PEG300 + 5% Tween80 + 45% Saline (add these co-solvents sequentially from left to right, and one by one), clear solution. For example, if 1 mL of working solution is to be prepared, you can add 100 μL of 12.5 mg/mL clear DMSO stock solution to 400 μL PEG300 and mix evenly; then add 50 μL Tween-80 to the above solution and mix evenly; then add 450 μL normal saline to adjust the volume to 1 mL. Preparation of saline: Dissolve 0.9 g of sodium chloride in 100 mL ddH₂ O to obtain a clear solution. Solubility in Formulation 2: ≥ 1.25 mg/mL (3.04 mM) (saturation unknown) in 10% DMSO + 90% Corn Oil (add these co-solvents sequentially from left to right, and one by one), clear solution. For example, if 1 mL of working solution is to be prepared, you can add 100 μL of 12.5 mg/mL clear DMSO stock solution to 900 μL of corn oil and mix evenly. (Please use freshly prepared in vivo formulations for optimal results.) |
| Preparing Stock Solutions | 1 mg | 5 mg | 10 mg | |
| 1 mM | 2.4347 mL | 12.1737 mL | 24.3475 mL | |
| 5 mM | 0.4869 mL | 2.4347 mL | 4.8695 mL | |
| 10 mM | 0.2435 mL | 1.2174 mL | 2.4347 mL |