Physicochemical Properties
| Exact Mass | 336.06 |
| Elemental Analysis | C, 64.27; H, 3.60; N, 8.33; O, 14.27; S, 9.53 |
| CAS # | 2285432-57-5 |
| Related CAS # | 2285432-57-5 |
| PubChem CID | 137518263 |
| Appearance | Light yellow to brown solid powder |
| Hydrogen Bond Donor Count | 2 |
| Hydrogen Bond Acceptor Count | 5 |
| Rotatable Bond Count | 3 |
| Heavy Atom Count | 24 |
| Complexity | 456 |
| Defined Atom Stereocenter Count | 0 |
| InChi Key | DYMDZGMAYKMYCT-UHFFFAOYSA-N |
| InChi Code | InChI=1S/C18H12N2O3S/c21-13-4-1-11(2-5-13)15-7-8-16(23-15)18(22)20-12-3-6-14-17(9-12)24-10-19-14/h1-10,21H,(H,20,22) |
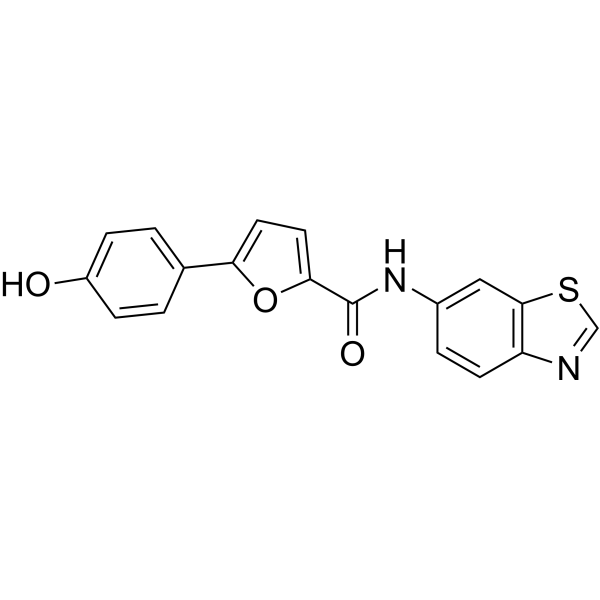
| Chemical Name | N-(benzo[d]thiazol-6-yl)-5-(4-hydroxyphenyl)furan-2-carboxamide |
| Synonyms | SLUPP-1072; SLU-PP 1072; SLU PP-1072; SLU-PP1072; SLU-PP-1072 |
| HS Tariff Code | 2934.99.9001 |
| Storage |
Powder-20°C 3 years 4°C 2 years In solvent -80°C 6 months -20°C 1 month |
Biological Activity
| Targets |
The target of SLU-PP-1072 is estrogen-related receptor α (ERRα) and estrogen-related receptor γ (ERRγ), and it acts as a selective inverse agonist for both targets. The dissociation constant (Ki) of SLU-PP-1072 with ERRα ligand-binding domain (LBD) is 14 nM, and with ERRγ LBD is 12 nM, as determined by fluorescence polarization assay[1] |
| ln Vitro |
1. Antiproliferative activity against prostate cancer cells: SLU-PP-1072 concentration-dependently inhibited the proliferation of human prostate cancer cell lines (androgen-sensitive LNCaP cells and androgen-insensitive PC-3 cells). After 72 hours of drug treatment, the half-maximal inhibitory concentration (IC50) was 1.2 μM for LNCaP cells and 0.8 μM for PC-3 cells, as measured by MTT assay[1] 2. Induction of apoptosis in prostate cancer cells: LNCaP and PC-3 cells were treated with 1 μM and 2 μM SLU-PP-1072 for 48 hours. Flow cytometry with Annexin V-FITC/PI double staining showed a significant increase in the proportion of apoptotic cells— the apoptosis rate of PC-3 cells increased by approximately 3.5-fold, and that of LNCaP cells increased by approximately 2.8-fold compared with the control group at 2 μM. Meanwhile, Western blot analysis revealed that the expression levels of pro-apoptotic proteins (cleaved caspase-3, cleaved PARP) were significantly upregulated, while the expression level of anti-apoptotic protein Bcl-2 was significantly downregulated[1] 3. Inhibition of the Warburg effect: Treatment with SLU-PP-1072 concentration-dependently reduced glucose uptake and lactate production in LNCaP and PC-3 cells. Using 2-NBDG (a fluorescent glucose analog) as a probe, glucose uptake was decreased by 40%-50% at 2 μM compared with the control group. Lactate production was reduced by 35%-45% at 2 μM, as detected by a lactate assay kit. Additionally, Western blot and quantitative real-time PCR (qPCR) showed that the protein and mRNA expression levels of key regulators of the Warburg effect (glucose transporter 1 GLUT1, hexokinase 2 HK2, lactate dehydrogenase A LDHA) were significantly downregulated[1] 4. Regulation of ERRα/γ downstream target genes: qPCR analysis indicated that after treatment with SLU-PP-1072, the mRNA expression levels of ERRα/γ downstream target genes related to mitochondrial energy metabolism (cytochrome c oxidase subunit 4 isoform 1 COX4I1, ATP synthase subunit β ATP5B) were significantly decreased. In PC-3 cells, the mRNA expression of COX4I1 and ATP5B was reduced by 55% and 48%, respectively, at 2 μM compared with the control group[1] |
| ln Vivo |
A subcutaneous xenograft model of PC-3 prostate cancer was established using 6-8 week-old male BALB/c nude mice. When the tumor volume reached approximately 100 mm³, the mice were randomly divided into 3 groups (6 mice per group): control group (administered with vehicle), SLU-PP-1072 low-dose group (25 mg/kg), and SLU-PP-1072 high-dose group (50 mg/kg). Drugs were administered via intraperitoneal injection, 5 times a week, for 21 consecutive days. The results showed: 1. SLU-PP-1072 dose-dependently inhibited xenograft growth; at the end of administration, the tumor volume in the 50 mg/kg group was reduced by 62%, and the tumor weight was reduced by 58% compared with the control group[1] 2. Immunohistochemical analysis of tumor tissues showed that the positive expression rate of Ki-67 (a cell proliferation marker) in the 50 mg/kg group was reduced by 45%, and the positive expression rate of cleaved caspase-3 (an apoptosis marker) was increased by 3-fold compared with the control group[1] 3. Tumor homogenate detection revealed that glucose uptake and lactate production in the SLU-PP-1072 treatment groups were significantly lower than those in the control group, and the protein expression levels of GLUT1, HK2, and LDHA were also significantly downregulated[1] |
| Enzyme Assay |
Fluorescence polarization (FP) assay was used to detect the binding affinity of SLU-PP-1072 to ERRα/γ ligand-binding domains (LBDs), with the following specific procedures: 1. Recombinant human ERRα-LBD and ERRγ-LBD proteins were prepared, ensuring their purity and activity met the experimental requirements[1] 2. Reaction system preparation: Different concentrations of SLU-PP-1072 (concentration range: 0.1 nM-10 μM) were mixed with a fixed concentration of recombinant ERR-LBD protein (20 nM) and a fluorescently labeled ERR agonist ligand (fluorescein-labeled GSK4716, 10 nM) in a buffer (containing 50 mM Tris-HCl pH 7.5, 100 mM NaCl, 1 mM DTT, 0.01% Tween-20), with 3 replicate wells per group[1] 3. The reaction system was incubated at room temperature for 1 hour, and then the fluorescence polarization value was detected using a fluorescence polarization detector (excitation wavelength: 485 nm, emission wavelength: 535 nm)[1] 4. A competitive binding curve was plotted with the concentration of SLU-PP-1072 as the abscissa and the fluorescence polarization value as the ordinate. GraphPad Prism software was used to fit the curve via nonlinear regression, and the Ki values of the drug with ERRα/γ-LBDs were calculated[1] |
| Cell Assay |
1. Cell proliferation assay (MTT method): LNCaP and PC-3 cells were seeded in 96-well plates at a density of 5×10³ cells/well. After 24 hours of culture, different concentrations of SLU-PP-1072 (0.1 μM-10 μM) were added, with 3 replicate wells per group. After 72 hours of further culture, 20 μL of MTT solution (5 mg/mL) was added to each well and incubated at 37℃ for 4 hours. The supernatant was discarded, and 150 μL of DMSO was added to each well to dissolve the formazan crystals. The absorbance was measured at 490 nm using a microplate reader. A dose-response curve was plotted with drug concentration as the abscissa and cell viability (relative to the control group) as the ordinate, and the IC50 value was calculated[1] 2. Cell apoptosis assay (Annexin V-FITC/PI double staining flow cytometry): LNCaP and PC-3 cells were seeded in 6-well plates at a density of 2×10⁵ cells/well. After 24 hours of culture, 1 μM and 2 μM SLU-PP-1072 were added, and the culture was continued for 48 hours. Cells were collected, washed twice with pre-cooled PBS, resuspended in 100 μL of Binding Buffer, and then 5 μL of Annexin V-FITC and 5 μL of PI staining solution were added. After incubation at room temperature in the dark for 15 minutes, 400 μL of Binding Buffer was added, and the proportion of apoptotic cells was detected by flow cytometry[1] 3. Glucose uptake assay: Cells were seeded in 24-well plates at a density of 5×10⁴ cells/well. After 24 hours of drug treatment, the medium was discarded, and the cells were washed twice with glucose-free DMEM. Glucose-free DMEM containing 10 μM 2-NBDG was added, and the cells were incubated at 37℃ for 30 minutes. After washing three times with PBS, the cells were digested with 0.25% trypsin, resuspended in PBS, and the intracellular fluorescence intensity was detected by flow cytometry (excitation wavelength: 488 nm, emission wavelength: 530 nm). The fluorescence intensity reflected the glucose uptake capacity[1] 4. Lactate production detection: After 48 hours of drug treatment, the culture supernatant was collected. According to the instructions of the lactate assay kit, the supernatant was mixed with the reaction reagent and incubated at 37℃ for 10 minutes. The absorbance was measured at 570 nm using a microplate reader, and the lactate concentration was calculated according to the standard curve[1] 5. Western blot assay: After drug treatment, total protein was extracted from cells using RIPA lysis buffer containing protease inhibitors and phosphatase inhibitors, and the protein concentration was determined by BCA method. 20-30 μg of protein was subjected to SDS-PAGE electrophoresis, and then the protein was transferred to a PVDF membrane. The membrane was blocked with 5% non-fat milk for 1 hour, and then incubated with primary antibodies (ERRα, GLUT1, HK2, LDHA, cleaved caspase-3, cleaved PARP, Bcl-2, β-actin) at 4℃ overnight. After washing three times with TBST, the membrane was incubated with fluorescent secondary antibody at room temperature for 1 hour. After three washes with TBST, ECL chemiluminescence kit was used for development, and ImageJ software was used for quantitative analysis of protein band gray values. β-actin was used as an internal reference to calculate the relative expression level of the target protein[1] 6. qPCR assay: After drug treatment, total RNA was extracted from cells using Trizol reagent, and cDNA was synthesized by reverse transcription. Using cDNA as a template, SYBR Green fluorescent quantitative PCR kit was used for amplification (reaction conditions: 95℃ pre-denaturation for 5 minutes, 95℃ denaturation for 15 seconds, 60℃ annealing and extension for 30 seconds, 40 cycles in total). GAPDH was used as the internal reference gene, and the 2^(-ΔΔCt) method was used to calculate the relative mRNA expression levels of target genes (GLUT1, HK2, LDHA, COX4I1, ATP5B)[1] |
| Animal Protocol |
1. Establishment of xenograft model: Under sterile conditions, PC-3 cells in the logarithmic growth phase (1×10⁷ cells/0.2 mL) were subcutaneously injected into the right back of 6-8 week-old male BALB/c nude mice. After inoculation, the mental state, activity, and diet of the mice were observed daily. The long diameter (L) and short diameter (W) of the tumor were measured with a vernier caliper every week, and the tumor volume was calculated using the formula V = (L×W²)/2. Drug administration was initiated when the tumor volume reached approximately 100 mm³[1] 2. Drug preparation: The administration vehicle of SLU-PP-1072 was prepared by mixing DMSO, PEG400, and normal saline at a volume ratio of 1:4:5. The drug concentration was adjusted according to the administration dose (25 mg/kg, 50 mg/kg) and mouse weight (administration volume was calculated as 10 μL/g body weight) to ensure that the drug was completely dissolved and the solution was clear without precipitation[1] 3. Grouping and administration: Tumor-bearing nude mice were randomly divided into 3 groups (6 mice per group): control group (intraperitoneal injection of equal volume of vehicle), SLU-PP-1072 low-dose group (25 mg/kg, intraperitoneal injection), and SLU-PP-1072 high-dose group (50 mg/kg, intraperitoneal injection). The administration frequency was 5 times a week (Monday to Friday) for 21 consecutive days[1] 4. Sample collection and processing: After the end of administration, the body weight of the mice was measured, and then the mice were sacrificed by cervical dislocation. The tumor tissues were stripped and weighed. Part of the tumor tissues was fixed in 4% paraformaldehyde solution (for subsequent immunohistochemical analysis), and the other part was immediately frozen in liquid nitrogen and then transferred to a -80℃ refrigerator for storage (for Western blot, qPCR detection, and determination of glucose uptake and lactate production)[1] |
| Toxicity/Toxicokinetics |
During the experimental period (21 days) of the PC-3 prostate cancer xenograft model in nude mice, no obvious toxic reactions were observed in the mice of the SLU-PP-1072 treatment groups (25 mg/kg, 50 mg/kg): 1. There was no significant difference in body weight of mice in each group before and after the experiment, and no weight loss (usually regarded as a basic indicator of toxic reactions) was observed[1] 2. The mice showed normal daily activities, with no abnormal manifestations such as fluffy hair, listlessness, or decreased food and water intake[1] 3. After sacrifice, the major organs (heart, liver, spleen, lung, kidney) of the mice were weighed, and there was no significant difference in organ weights among the groups. The literature did not detect plasma protein binding rate, liver and kidney function biochemical indicators (such as ALT, AST, BUN, Cr), or median lethal dose (LD50)[1] |
| References |
[1]. A Selective ERRα/γ Inverse Agonist, SLU-PP-1072, Inhibits the Warburg Effect and Induces Apoptosis in Prostate Cancer Cells. ACS Chem Biol. 2020 Sep 18;15(9):2338-2345. |
| Additional Infomation |
1. Mechanism of action: As a selective inverse agonist of ERRα/γ, SLU-PP-1072 binds to the ligand-binding domains of ERRα/γ, thereby inhibiting the transcriptional activity of ERRα/γ. This further downregulates the expression of two key types of downstream targets: mitochondrial energy metabolism-related genes (COX4I1, ATP5B) and Warburg effect-related genes (GLUT1, HK2, LDHA). Eventually, this leads to insufficient energy supply in prostate cancer cells and simultaneous activation of the apoptotic pathway, achieving inhibition of tumor cells[1] 2. Research significance: ERRα/γ is highly expressed in prostate cancer (especially androgen-insensitive prostate cancer) and is associated with tumor progression and poor prognosis, making it a potential target for prostate cancer treatment. SLU-PP-1072 has confirmed its inhibitory activity against prostate cancer cells and ERRα/γ targeting through in vitro and in vivo experiments, providing a new candidate drug direction for the treatment of prostate cancer (especially refractory androgen-insensitive prostate cancer)[1] |
Solubility Data
| Solubility (In Vitro) | DMSO: ~125 mg/mL (~371.6 mM) |
| Solubility (In Vivo) |
Note: Listed below are some common formulations that may be used to formulate products with low water solubility (e.g. < 1 mg/mL), you may test these formulations using a minute amount of products to avoid loss of samples. Injection Formulations (e.g. IP/IV/IM/SC) Injection Formulation 1: DMSO : Tween 80: Saline = 10 : 5 : 85 (i.e. 100 μL DMSO stock solution → 50 μL Tween 80 → 850 μL Saline) *Preparation of saline: Dissolve 0.9 g of sodium chloride in 100 mL ddH ₂ O to obtain a clear solution. Injection Formulation 2: DMSO : PEG300 :Tween 80 : Saline = 10 : 40 : 5 : 45 (i.e. 100 μL DMSO → 400 μLPEG300 → 50 μL Tween 80 → 450 μL Saline) Injection Formulation 3: DMSO : Corn oil = 10 : 90 (i.e. 100 μL DMSO → 900 μL Corn oil) Example: Take the Injection Formulation 3 (DMSO : Corn oil = 10 : 90) as an example, if 1 mL of 2.5 mg/mL working solution is to be prepared, you can take 100 μL 25 mg/mL DMSO stock solution and add to 900 μL corn oil, mix well to obtain a clear or suspension solution (2.5 mg/mL, ready for use in animals). Injection Formulation 4: DMSO : 20% SBE-β-CD in saline = 10 : 90 [i.e. 100 μL DMSO → 900 μL (20% SBE-β-CD in saline)] *Preparation of 20% SBE-β-CD in Saline (4°C,1 week): Dissolve 2 g SBE-β-CD in 10 mL saline to obtain a clear solution. Injection Formulation 5: 2-Hydroxypropyl-β-cyclodextrin : Saline = 50 : 50 (i.e. 500 μL 2-Hydroxypropyl-β-cyclodextrin → 500 μL Saline) Injection Formulation 6: DMSO : PEG300 : castor oil : Saline = 5 : 10 : 20 : 65 (i.e. 50 μL DMSO → 100 μLPEG300 → 200 μL castor oil → 650 μL Saline) Injection Formulation 7: Ethanol : Cremophor : Saline = 10: 10 : 80 (i.e. 100 μL Ethanol → 100 μL Cremophor → 800 μL Saline) Injection Formulation 8: Dissolve in Cremophor/Ethanol (50 : 50), then diluted by Saline Injection Formulation 9: EtOH : Corn oil = 10 : 90 (i.e. 100 μL EtOH → 900 μL Corn oil) Injection Formulation 10: EtOH : PEG300:Tween 80 : Saline = 10 : 40 : 5 : 45 (i.e. 100 μL EtOH → 400 μLPEG300 → 50 μL Tween 80 → 450 μL Saline) Oral Formulations Oral Formulation 1: Suspend in 0.5% CMC Na (carboxymethylcellulose sodium) Oral Formulation 2: Suspend in 0.5% Carboxymethyl cellulose Example: Take the Oral Formulation 1 (Suspend in 0.5% CMC Na) as an example, if 100 mL of 2.5 mg/mL working solution is to be prepared, you can first prepare 0.5% CMC Na solution by measuring 0.5 g CMC Na and dissolve it in 100 mL ddH2O to obtain a clear solution; then add 250 mg of the product to 100 mL 0.5% CMC Na solution, to make the suspension solution (2.5 mg/mL, ready for use in animals). Oral Formulation 3: Dissolved in PEG400 Oral Formulation 4: Suspend in 0.2% Carboxymethyl cellulose Oral Formulation 5: Dissolve in 0.25% Tween 80 and 0.5% Carboxymethyl cellulose Oral Formulation 6: Mixing with food powders Note: Please be aware that the above formulations are for reference only. InvivoChem strongly recommends customers to read literature methods/protocols carefully before determining which formulation you should use for in vivo studies, as different compounds have different solubility properties and have to be formulated differently. (Please use freshly prepared in vivo formulations for optimal results.) |