Physicochemical Properties
| Molecular Formula | C22H27N5O4S |
| Molecular Weight | 457.54588341713 |
| Exact Mass | 285.16 |
| Elemental Analysis | C, 57.75; H, 5.95; N, 15.31; O, 13.99; S, 7.01 |
| CAS # | 2192215-81-7 |
| Related CAS # | 1792180-81-4;2140301-97-7 (malonate);2192215-81-7;2489392-29-0; |
| PubChem CID | 145722621 |
| Appearance | White to off-white solid |
| Hydrogen Bond Donor Count | 3 |
| Hydrogen Bond Acceptor Count | 7 |
| Rotatable Bond Count | 4 |
| Heavy Atom Count | 32 |
| Complexity | 608 |
| Defined Atom Stereocenter Count | 2 |
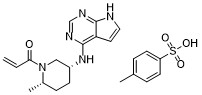
| SMILES | C[C@H]1CC[C@H](CN1C(=O)C=C)NC2=NC=NC3=C2C=CN3.CC1=CC=C(C=C1)S(=O)(=O)O |
| InChi Key | YOZLVAFWYLSRRN-VZXYPILPSA-N |
| InChi Code | InChI=1S/C15H19N5O.C7H8O3S/c1-3-13(21)20-8-11(5-4-10(20)2)19-15-12-6-7-16-14(12)17-9-18-15;1-6-2-4-7(5-3-6)11(8,9)10/h3,6-7,9-11H,1,4-5,8H2,2H3,(H2,16,17,18,19);2-5H,1H3,(H,8,9,10)/t10-,11+;/m0./s1 |
| Chemical Name | 1-{(2S,5R)-2-methyl-5-[(7H-pyrrolo[2,3-d]pyrimidin-4-yl)amino]piperidin-1-yl}prop-2-en-1-one tosylate |
| Synonyms | Ritlecitinib tosylate; Ritlecitinib; PF-06651600; PF 06651600; PF06651600; PF-6651600; PF 6651600; PF6651600; |
| HS Tariff Code | 2934.99.9001 |
| Storage |
Powder-20°C 3 years 4°C 2 years In solvent -80°C 6 months -20°C 1 month |
| Shipping Condition | Room temperature (This product is stable at ambient temperature for a few days during ordinary shipping and time spent in Customs) |
Biological Activity
| Targets | JAK3 (IC50 = 33.1 nM) | ||
| ln Vitro | Ritlecitinib is a powerful JAK3-selective inhibitor that has an IC50 of 33.1 nM for inhibiting JAK3 kinase activity, but no activity (IC50>10,000 nM) against JAK1, JAK2, and TYK2. With IC50 values of 244, 340, 407, and 266 nM, respectively, ritlecitinib suppresses the phosphorylation of STAT5 induced by IL-2, IL-4, IL-7, and IL-15. With an IC50 of 355 nM, ritlecitinib also prevents IL-21-induced STAT3 phosphorylation. Ritlecitinib inhibits Th1 and Th17 differentiation (measured by IFNγ after 5 days under Th1 circumstances and IL-17 production after 6 days under Th17 settings) in T-cell differentiation assays, according to functional assessment (IC50 values: 30 nM and 167 nM, respectively). Additionally, ritlecitinib inhibits Th1 and Th17 function as demonstrated by the suppression of IFNγ production (IC50=48 nM) and IL-17 production (IC50=269 nM) in cells that have undergone prior differentiation and resting before PF-06651600 treatment[1]. | ||
| ln Vivo | Ritlecitinib reduces paw swelling in the rat adjuvant-induced arthritis (AIA) model, with an unbound EC50 of 169 nM. In the experimental autoimmune encephalomyelitis (EAE) mouse model, ritlecitinib, administered either therapeutically at 30 or 100 mg/kg or prophylactically at 20 or 60 mg/kg, significantly reduces the severity of the disease. Ritlecitinib's effectiveness in treating inflammatory and autoimmune diseases in these two rodent models shows that JAK3-selective inhibition alone may be enough to modify disease in humans[1]. | ||
| Enzyme Assay |
JAK enzyme assays.[1] Human Janus kinase (JAK) activity was determined using a microfluidic assay to monitor phosphorylation of a synthetic peptide by the recombinant human kinase domain of each of the four members of the JAK family, JAK1, JAK2, JAK3, and TYK2. GSTtagged recombinant human kinase domains of JAK1, JAK2, and JAK3 were purchased from Life Technologies. His-tagged recombinant human TYK2 kinase domain was expressed in SF21/baculovirus and purified using a two-step affinity (Ni-NTA) and size-exclusion (SEC S200) purification method. Test compounds were solubilized in dimethyl sulfoxide (DMSO) to a stock concentration of 30 mM. Compounds were diluted in DMSO to create an 11-point half log dilution series with a top concentration of 600 µM. The test compound plate also contained positive control wells containing a known inhibitor to define 100% inhibition and negative control wells containing DMSO to define no inhibition. The compound plates were diluted 1 to 60 in the assay, resulting in a final assay compound concentration range of 10 µM to 100 pM and a final assay concentration of 1.7% DMSO. Test compounds and controls solubilized in 100% DMSO were added (250 nL) to a 384 well polypropylene plate (Matrical) using a non contact acoustic dispenser. Kinase assays were carried out at room temperature in a 15 µL reaction buffer containing 20 mM HEPES, pH 7.4, 10 mM magnesium chloride, 0.01% bovine serum albumin (BSA), 0.0005% Tween 20 and 1mM Dithiothreitol (DTT). Reaction mixtures contained 1 µM of a fluorescently labeled synthetic peptide, at a concentration less than the apparent Michaelis-Menten constant (Km) (5FAM-KKSRGDYMTMQID for JAK1 and TYK2 and FITC-KGGEEEEYFELVKK for JAK2 and JAK3). Reaction mixtures contained adenosine triphosphate (ATP) at either a level equal to the apparent Km for ATP (40 µM for JAK1, 4 µM for JAK2, 4 µM for JAK3 and 12 µM for TYK2) or at 1 mM ATP. Compound was added to the buffer containing ATP and substrate and immediately after this step the enzyme was added to begin the reaction. The assays were stopped with 15 µL of a buffer containing 180 mM HEPES, pH=7.4, 20 mM EDTA, 0.2% Coating Reagent, resulting in a final concentration of 10 mM EDTA, 0.1% Coating Reagent and 100 mM HEPES, pH=7.4. The assay plates were placed on a Caliper Life Science Lab Chip 3000 (LC3000) instrument or Caliper Life Science EZ Reader instrument and each well was sampled using appropriate separation conditions to determine the level of phosphorylation[1]. Binding and inactivation kinetics of JAK3.[1] The kinetics of PF-06651600 binding to and inactivation of JAK3 and a panel of kinases that contained a Cys in the equivalent position as Cys909 in JAK3 were measured using a time-resolved Förster resonance energy transfer (TRFRET) assay based on the LanthaScreen Eu Kinase Binding Assay (Invitrogen/Life Technologies). Kinase-specific reagents and assay validation can be found at: https://www.thermofisher.com/us/en/home/industrial/pharma-biopharma/drug-discoverydevelopment/target-and-lead-identification-and-validation/kinasebiology/kinase-activityassays/lanthascreentm-eu-kinase-binding-assay/lanthascreen-eu-kinase-binding-assay-validationtable.html. Assay buffer was 20 mM HEPES, pH 7.5, 10 mM MgCl2, 0.01% BSA, 1 mM DTT, 0.0005% Tween 20, and 2% DMSO. Inactivation kinetic reactions were performed by preparing 15 µL of a 1.33Χ solution of (final concentrations) 2 nM Eu-Ab, 1-8 nM kinase (optimal concentrations of each kinase were empirically determined) and a variable concentration of PF06651600, and pre-incubating this for a variable amount of time (detailed below). This was then combined this with 5 µL of 4X solution of the validated probe (150 nM, final concentration). For all kinases, the following experiments were performed: (A) [PF-06651500] = 0, 4.9, 14.8, 44.4, 133.3, and 400 nM; pre-incubation time = 2 h. (B) [PF-06651500] = 0, 0.5, 1.0, 2.0, 4.0, and 8.0 µM; pre-incubation time = 120 s. For JAK3, the following additional experiments were performed: [PF-06651500] = 0, 0.66, 1.98, 5.93, 17.8, 53.3, 160, 480 nM; pre-incubation time of (C) 30 s, (D) 60 s, and (E) 1.5 h. The assays were read using an EnVision plate reader. The excitation wavelength was 340 nm, and the output monitored was the emission ratio, calculated by dividing the signal from the emission peak of the probe (665 nm) by that of the europium (615 nm). Measurements were taken every 120 s for 1.5 h. Recombinant TXK kinase (N-terminal GST-fusion protein) failed to produce a suitable TR-FRET signal in combination with anti-GST Eu-antibody (Life Technologies) and probe. Thus, an alternative approach was taken to measure kinact/Ki , utilizing the classic pyruvate kinase/lactate dehydrogenase (PK/LDH) coupled enzyme assay. In the PK/LDH assay, ADP, which is a product of the kinase reaction, is measured by coupling its production first to the dephosphorylation of phosphoenolpyruvate (PEP) to form pyruvate, which is coupled to NADH-dependent reduction of pyruvate to form lactate. The concomitant oxidation of NADH to form NAD+ is monitored spectrophotometrically by loss of absorbance at 340 nm. The TXK kinase buffer was: 50 mM HEPES, pH 7.5, 10 mM Mg2Cl, 0.01% Triton X-100, 1 mM DTT, and 1% DMSO. Also included (PK/LDH assay reagents): 0.25 mM NADH (Sigma, N8129), 2.5 mM phosphoenolpyruvate (PEP), 12 U/mL pyruvate kinase (PK) and 18 U/mL lactate dehydrogenase (LDH). Final substrate concentrations were 100 µM each ATP and Srctide peptide (sequence: GEPLYWSFPAKKK). In each experiment, 10 µL of PF-06651600 solution (concentration during preincubation: 0, 10.4167, 20.83, 41.67, 83.3, 333.3, 666.7, 1333.3, 2666.7 nM) was combined with 20 µL of solution containing TXK kinase (34 nM concentration during pre-incubation) + PK/LDH solution reagents. After a variably timed pre-incubation period (15 min, 30 min, 1 h, 1.5 h, and 2 h), 10 µL of 4Χ ATP/peptide substrate was added to initiate the reaction. Human serum albumin binding of PF-06651600. [1] Human recombinant serum albumin (HSA) expressed in Saccharomyces cerevisiae was obtained as a 1.5 mM solution and used by dilution into Dulbecco's phosphate-buffered saline (PBS) without further processing. HSA was incubated with compounds diluted into PBS from 8 mM stock solutions made in DMSO as indicated in the legend to fig. S3 for 22 h, after which the protein was subjected to direct mass analysis by liquid chromatography-mass spectrometry using an Agilent 1100 HPLC system and a Waters LCT Premier XE mass spectrometer as described previously1 . Mass distribution of the protein was extracted from the spectra averaged over the protein peak using MaxEnt 1 software (incorporated into the Waters MassLynx program) run for 20 iterations with a target mass range of 66,000-67,500 Da. Covalent Binding in Human Hepatocytes.[1] Pooled cryopreserved human hepatocytes were suspended in Williams’ E Media (GIBCO, ThermoFisherScientific) at a final concentration of 750,000 cells/mL (n=2). Cell viability based on trypan blue exclusion was >80%. The cell suspensions (4 mL) were incubated at 37oC for up to 4 h with radiolabeled substrate (1 µM). Aliquots were removed at 240 min, quenched with acetonitrile, centrifuged at 3500 rpm for 15 min and exhaustively extracted (N=7) with a combination of organic solvents (acetonitrile: methanol, acetonitrile and acetonitrile:0.1% formic acid in water). Supernatant fractions were monitored until radioactivity levels were below twice the level of background (80 dpm). NaOH (1M) was added to the remaining protein pellet and placed in a water bath overnight to dissolve and the total radioactivity was determined by liquid scintillation counting. Protein concentrations were determined using the Bradford Protein assay. LC-MS/MS of JAK3 occupancy and p-STAT5 inhibition in human whole blood.[1] Occupancy of JAK3 by an irreversible covalent inhibitor was measured utilizing LC/MS-MS surrogate tryptic peptide analysis. Human JAK3 protein sequence (Uniprot accession number P52333) was used to verify the sequence of a tryptic peptide containing 909Cys, the covalent molecule binding target. A favorably sized peptide with the sequence LVMEYLPSGCLR is generated by tryptic cleavage of the JAK3 protein using MS grade Trypsin/Lys-C enzyme mix. Bound-to-inhibitor and free peptide was measured by MRM mode IA-LC-MS/MS analysis which included an online anti-peptide antibody immuno-affinity enrichment step. Double immuno-precipitation at the protein and peptide level provided ample sample enrichment for free and bound LVME peptide in PBMC samples generated from human whole blood. Biotinylated antihuman JAK3 polyclonal capture antibody was obtained from Santa Cruz. Extended sequence stable isotope labeled (SIL) peptide containing a tryptic cleavage site was custom synthesized by New England Peptide... |
||
| Cell Assay |
Th1 cell differentiation.[1] Cryopreserved human normal peripheral blood CD4+/CD45RA+/CD25- naïve T cells were purchased from Allcells. Frozen CD4+/CD45RA+/CD25- naïve T cells were thawed in a water bath (37o C), and washed once with RPMI1640 medium. Cells were resuspended at 200,000 cells/mL in RPMI medium containing 10% fetal bovine serum (FBS), IL-2 (10 ng/mL), IL-12 (5 ng/mL), anti-IL-4 (5 ng/mL), anti-CD3 (10 µg/mL) and anti-CD28 (0.1 µg/mL) antibodies. To evaluate the effect of PF-06651600 during the differentiation phase of Th1 cells, resuspended naïve CD4+ T cells were cultured for 5 days in the presence of 11 different concentrations of JAK inhibitors (0.2% DMSO final). Supernatants were harvested and the concentrations of IFNγ were measured with MSD according to manufacturer’s instructions. To study the effect of PF06651600 on Th1 cells post differentiation skewed Th1 cells were resuspended in RPMI medium containing 10% FBS and cultured under cytokine free conditions for 7 h. Cells were then harvested and cultured in the presence of 10% FBS, IL-2 (10 ng/mL), IL-12 (5 ng/mL), anti-IL-4 antibody (5 ng/mL), plus 11 different concentrations of PF-06651600 in 96-well plates for 2 additional days. The concentration of IFNγ was determined as described above. Th17 cell differentiation.[1] Human CD4+ T cells were purified from buffy coat with RosetteSep CD4+ T Cell Enrichment Cocktail and skewed for 6 days with cytokine cocktails (25 ng/mL of IL-6, 25 ng/mL of IL-23, 12.5 ng/mL of IL-1β, 25 ng/mL of IL21, 5 ng/mL of TGFβ1, 10 µg/ml of anti-CD3 antibody (pre-coated on plate surface) and 1 µg/mL of anti-CD28 antibody) in the presence of JAK inhibitors at 10 different concentrations. Supernatants were harvested and the concentrations of IL-17A were determined with MSD assay following the protocol provided by the manufacturer. To study the effect of PF-06651600 on Th17 cells post differentiation, skewed Th17 cells were washed, rested with X-VIVO 15 medium (Lonza) for overnight and resuspended in medium containing the same concentrations of cytokines as during skewing but without anti-CD3 or anti-CD28 antibodies, in the presence of PF-06651600 at 10 different concentrations for 2 additional days. On Day 9, supernatant was harvested from each well and IL-17A was determined as described above. JAK3 half-life in human T cells.[1] CD4+ cells were purified by negative selection from Buffy coat (SeraCare) and cryopreserved. Ten million cells were thawed in RPMI supplemented with 10% FBS (Sigma) 100 U/mL penicillin/100 µg/mL streptomycin (Gibco), 2 mM L-glutamin, 100 µM Non-essential amino acid, 1 mM sodium pyruvate, 20 mM HEPES and 2 ng/ml IL-2. After 2 h at 37 °C in 5% CO2 CD3/CD28 magnetic beads were added (ratio of 3 beads/cell). Seventy two hours later the beads were removed and 800 million cells were used for the pulse chase experiments. Each data point utilized 40 million cells. Cells were supplemented with media supplemented with 500 µCi S35 labeled Cys/Met at 37 °C in 5% CO2 for 30 minutes followed by two washes in PBS. The cells were then incubated for various length of time in media supplemented with 200 µM Cys/Met and lysed in cold lysis buffer before being stored at - 80 °C. The lysates were thawed on ice and subjected to immunoprecipitation with anti-JAK3 antibodies overnight at 4 °C. Protein G magnetic beads were used to capture the anti-JAK3 antibodies. JAK3 was then eluted in 60 µl Laemmli with 5% BME and subjected to electrophoresis and quantification on phosphorimager. |
||
| Animal Protocol |
|
||
| ADME/Pharmacokinetics |
Absorption, Distribution and Excretion Up to 200 mg, the AUC0-tau and Cmax of ritlecitinib increase in an approximately dose-proportional manner, and steady state is reached approximately by day 4. Ritlecitinib has an absolute oral bioavailability of approximately 64%, and 1 hour after an oral dose is administered, peak plasma concentrations are achieved. Food does not have a clinically significant impact on the systemic exposures of ritlecitinib. The co-administration of a high-fat meal and a 100 mg ritlecitinib capsule reduced Cmax by 32% and increased AUCinf by 11%. Ritlecitinib was administered without regard to meals during clinical trials. Ritlecitinib is mainly excreted through urine and feces. Approximately 66% and 20% of radiolabeled ritlecitinib are excreted in the urine and feces, respectively. Approximately 4% of the ritlecitinib dose is excreted unchanged drug in urine. Ritlecitinib is predicted to have a volume of distribution of 1.3 L/kg. Ritlecitinib is predicted to have a blood clearance of 5.6 mL/min/kg. Metabolism / Metabolites Ritlecitinib is metabolized by cytochrome P450 (CYP) and glutathione-S-transferase (GST) enzymes. The GST enzymes participating in the metabolism of ritlecitinib include cytosolic GST A1/3, M1/3/5, P1, S1, T2, Z1 and microsomal GST 1/2/3, and the CYP enzymes participating in this process include CYP3A, CYP2C8, CYP1A2, and CYP2C9. No single route contributes to more than 25% of the total metabolism of ritlecitinib. Biological Half-Life Ritlecitinib has a terminal half-life that ranges from 1.3 to 2.3 hours. |
||
| Toxicity/Toxicokinetics |
Hepatotoxicity In the prelicensure clinical trials in alopecia areata, serum aminotransferase elevations occurred in 1% to 3% of ritlecitinib treated subjects, but similar rates were found in placebo recipients. The elevations were typically mild and transient, and values above 5 times the upper limit of normal (ULN) occurred in less than 1% of patients. The elevations rarely led to early discontinuations, and often resolved even without dose adjustment. In prelicensure studies in alopecia areata and other autoimmune conditions, there were no instances of liver related severe adverse events or clinically apparent liver injury attributed to ritlecitinib. Since approval and more widescale availability of ritlecitinib, there have been no published reports of hepatotoxicity associated with its use. Finally, ritlecitinib is an immune modulatory agent and has the potential of causing reactivation of viral infections including hepatitis B. Other JAK inhibitors have been implicated in rare instances of reactivation of hepatitis B, although the episodes were usually asymptomatic and self-limited in course. The risk of reactivation of hepatitis B in patients with HBsAg or with anti-HBc without HBsAg who are treated with ritlecitinib has not been defined. Likelihood score: E* (unlikely cause of idiosyncratic clinically apparent liver injury, but is a potential cause of reactivation of hepatitis B). Hepatotoxicity In the prelicensure clinical trials in alopecia areata, serum aminotransferase elevations occurred in 1% to 3% of ritlecitinib treated subjects, but similar rates were found in placebo recipients. The elevations were typically mild and transient, and values above 5 times the upper limit of normal (ULN) occurred in less than 1% of patients. The elevations rarely led to early discontinuations, and often resolved even without dose adjustment. In prelicensure studies in alopecia areata and other autoimmune conditions, there were no instances of liver related severe adverse events or clinically apparent liver injury attributed to ritlecitinib. Since approval and more widescale availability of ritlecitinib, there have been no published reports of hepatotoxicity associated with its use. Finally, ritlecitinib is an immune modulatory agent and has the potential of causing reactivation of viral infections including hepatitis B. Other JAK inhibitors have been implicated in rare instances of reactivation of hepatitis B, although the episodes were usually asymptomatic and self-limited in course. The risk of reactivation of hepatitis B in patients with HBsAg or with anti-HBc without HBsAg who are treated with ritlecitinib has not been defined. Likelihood score: E* (unlikely cause of idiosyncratic clinically apparent liver injury, but is a potential cause of reactivation of hepatitis B). Effects During Pregnancy and Lactation ◉ Summary of Use during Lactation No information is available on the clinical use of ritlecitinib during breastfeeding. Because of the risk of serious adverse effects, including malignancy, the manufacturer recommends that breastfeeding be discontinued during ritlecitinib therapy and for 14 hours after the last dose. ◉ Effects in Breastfed Infants Relevant published information was not found as of the revision date. ◉ Effects on Lactation and Breastmilk Relevant published information was not found as of the revision date. Protein Binding Ritlecitinib is 14% bound to plasma proteins. |
||
| References |
[1]. Discovery of a JAK3-Selective Inhibitor: Functional Differentiation of JAK3-Selective Inhibition over pan-JAK or JAK1-Selective Inhibition. ACS Chem Biol. 2016 Dec 16;11(12):3442-3451. |
||
| Additional Infomation |
Ritlecitinib tosylate is an organosulfonate salt obtained by combining equimolar amounts of ritlecitinib and 4-toluenesulfonic acid. It is a kinase inhibitor, developed by Pfizer for the treatment of severe alopecia areata in adults and adolescents 12 years and older. It has a role as an anti-inflammatory drug, an EC 2.7.10.2 (non-specific protein-tyrosine kinase) inhibitor, an immunosuppressive agent, an antirheumatic drug and a dermatologic drug. It contains a ritlecitinib(1+). See also: Ritlecitinib (has active moiety). Drug Indication Litfulo is indicated for the treatment of severe alopecia areata in adults and adolescents 12 years of age and older. |
Solubility Data
| Solubility (In Vitro) | DMSO: > 10 mM |
| Solubility (In Vivo) |
Note: Listed below are some common formulations that may be used to formulate products with low water solubility (e.g. < 1 mg/mL), you may test these formulations using a minute amount of products to avoid loss of samples. Injection Formulations (e.g. IP/IV/IM/SC) Injection Formulation 1: DMSO : Tween 80: Saline = 10 : 5 : 85 (i.e. 100 μL DMSO stock solution → 50 μL Tween 80 → 850 μL Saline) *Preparation of saline: Dissolve 0.9 g of sodium chloride in 100 mL ddH ₂ O to obtain a clear solution. Injection Formulation 2: DMSO : PEG300 :Tween 80 : Saline = 10 : 40 : 5 : 45 (i.e. 100 μL DMSO → 400 μLPEG300 → 50 μL Tween 80 → 450 μL Saline) Injection Formulation 3: DMSO : Corn oil = 10 : 90 (i.e. 100 μL DMSO → 900 μL Corn oil) Example: Take the Injection Formulation 3 (DMSO : Corn oil = 10 : 90) as an example, if 1 mL of 2.5 mg/mL working solution is to be prepared, you can take 100 μL 25 mg/mL DMSO stock solution and add to 900 μL corn oil, mix well to obtain a clear or suspension solution (2.5 mg/mL, ready for use in animals). Injection Formulation 4: DMSO : 20% SBE-β-CD in saline = 10 : 90 [i.e. 100 μL DMSO → 900 μL (20% SBE-β-CD in saline)] *Preparation of 20% SBE-β-CD in Saline (4°C,1 week): Dissolve 2 g SBE-β-CD in 10 mL saline to obtain a clear solution. Injection Formulation 5: 2-Hydroxypropyl-β-cyclodextrin : Saline = 50 : 50 (i.e. 500 μL 2-Hydroxypropyl-β-cyclodextrin → 500 μL Saline) Injection Formulation 6: DMSO : PEG300 : castor oil : Saline = 5 : 10 : 20 : 65 (i.e. 50 μL DMSO → 100 μLPEG300 → 200 μL castor oil → 650 μL Saline) Injection Formulation 7: Ethanol : Cremophor : Saline = 10: 10 : 80 (i.e. 100 μL Ethanol → 100 μL Cremophor → 800 μL Saline) Injection Formulation 8: Dissolve in Cremophor/Ethanol (50 : 50), then diluted by Saline Injection Formulation 9: EtOH : Corn oil = 10 : 90 (i.e. 100 μL EtOH → 900 μL Corn oil) Injection Formulation 10: EtOH : PEG300:Tween 80 : Saline = 10 : 40 : 5 : 45 (i.e. 100 μL EtOH → 400 μLPEG300 → 50 μL Tween 80 → 450 μL Saline) Oral Formulations Oral Formulation 1: Suspend in 0.5% CMC Na (carboxymethylcellulose sodium) Oral Formulation 2: Suspend in 0.5% Carboxymethyl cellulose Example: Take the Oral Formulation 1 (Suspend in 0.5% CMC Na) as an example, if 100 mL of 2.5 mg/mL working solution is to be prepared, you can first prepare 0.5% CMC Na solution by measuring 0.5 g CMC Na and dissolve it in 100 mL ddH2O to obtain a clear solution; then add 250 mg of the product to 100 mL 0.5% CMC Na solution, to make the suspension solution (2.5 mg/mL, ready for use in animals). Oral Formulation 3: Dissolved in PEG400 Oral Formulation 4: Suspend in 0.2% Carboxymethyl cellulose Oral Formulation 5: Dissolve in 0.25% Tween 80 and 0.5% Carboxymethyl cellulose Oral Formulation 6: Mixing with food powders Note: Please be aware that the above formulations are for reference only. InvivoChem strongly recommends customers to read literature methods/protocols carefully before determining which formulation you should use for in vivo studies, as different compounds have different solubility properties and have to be formulated differently. (Please use freshly prepared in vivo formulations for optimal results.) |
| Preparing Stock Solutions | 1 mg | 5 mg | 10 mg | |
| 1 mM | 2.1856 mL | 10.9278 mL | 21.8555 mL | |
| 5 mM | 0.4371 mL | 2.1856 mL | 4.3711 mL | |
| 10 mM | 0.2186 mL | 1.0928 mL | 2.1856 mL |