Physicochemical Properties
| Molecular Formula | C14H9IN4O2 |
| Molecular Weight | 392.151334524155 |
| Exact Mass | 391.977 |
| CAS # | 1809031-84-2 |
| PubChem CID | 122190591 |
| Appearance | Light yellow to yellow solid powder |
| LogP | 3.5 |
| Hydrogen Bond Donor Count | 0 |
| Hydrogen Bond Acceptor Count | 4 |
| Rotatable Bond Count | 2 |
| Heavy Atom Count | 21 |
| Complexity | 379 |
| Defined Atom Stereocenter Count | 0 |
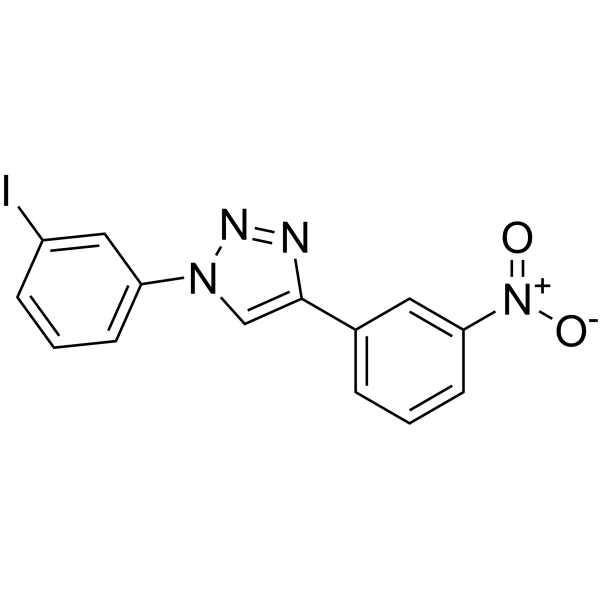
| SMILES | N1(C2=CC=CC(I)=C2)C=C(C2=CC=CC([N+]([O-])=O)=C2)N=N1 |
| InChi Key | LSVWEYNSNZJEGB-UHFFFAOYSA-N |
| InChi Code | InChI=1S/C14H9IN4O2/c15-11-4-2-5-12(8-11)18-9-14(16-17-18)10-3-1-6-13(7-10)19(20)21/h1-9H |
| Chemical Name | 1-(3-iodophenyl)-4-(3-nitrophenyl)triazole |
| HS Tariff Code | 2934.99.9001 |
| Storage |
Powder-20°C 3 years 4°C 2 years In solvent -80°C 6 months -20°C 1 month |
| Shipping Condition | Room temperature (This product is stable at ambient temperature for a few days during ordinary shipping and time spent in Customs) |
Biological Activity
| Targets | P62-mediated inducer of mitophagy (10 μM; 0, 1, 3, 6, 24 hours) stabilizes Nrf2, and increases P62 expression (10 μM; 9 hours) to initiate mitophagy [1]. In MEFs, PINK1/Parkin signaling pathway is downstreamly acted upon by P62-mediated mitophagy (10 μM; 24 hours) [1]. Polyubiquitination and conjugation within the mitochondria are positively impacted by P62-mediated mitophagy inducers [1]. |
| ln Vitro |
P62-mediated inducer of mitophagy (10 μM; 0, 1, 3, 6, 24 hours) stabilizes Nrf2, and increases P62 expression (10 μM; 9 hours) to initiate mitophagy [1]. In MEFs, PINK1/Parkin signaling pathway is downstreamly acted upon by P62-mediated mitophagy (10 μM; 24 hours) [1]. Polyubiquitination and conjugation within the mitochondria are positively impacted by P62-mediated mitophagy inducers [1]. PMI (10 µM) stabilized Nrf2 protein levels in mouse embryonic fibroblasts (MEFs), with maximal levels observed at 6 hours post-treatment, which remained elevated at 24 hours. [1] PMI (10 µM) increased the expression of Nrf2-dependent gene products heme oxygenase-1 (HO-1) and NAD(P)H quinone dehydrogenase 1 (NQO1) in mouse Hepatic1c7 cells over time, with peak cytoplasmic HO-1 at 6 hours and NQO1 at 24 hours. [1] PMI induced NQO1 enzymatic activity with a CD (concentration causing a 2-fold induction) of 0.6 µM and a maximal 3.7-fold induction at 10 µM. [1] PMI (10 µM) significantly increased p62 mRNA levels in MEFs after 9 hours of treatment, as measured by quantitative RT-PCR. [1] PMI (10 µM, 24 hours) increased cytosolic P62 protein levels by 1.8-fold in MEFs compared to untreated controls, as shown by western blot. [1] PMI (10 µM, 24 hours) did not increase the conversion of LC3B-I to LC3B-II in the cytoplasmic fraction of MEFs, either in the absence or presence of the autophagy inhibitor bafilomycin A1, indicating it does not trigger general macroautophagy. [1] PMI (10 µM, 24 hours) reduced the size of the mitochondrial network in MEFs, as visualized by immunofluorescence staining of the mitochondrial F1-FO-ATP synthase β-subunit. [1] PMI (10 µM, 24 hours) decreased the levels of the mitochondrial inner membrane protein MTCO1 (cytochrome c oxidase subunit I) in MEFs, as shown by western blot. [1] PMI (10 µM, 24 hours) increased the level of LC3-II in the mitochondrial fraction of wild-type (WT) MEFs, but not in p62-/- MEFs, as shown by western blot. [1] PMI (10 µM, 24 hours) dramatically increased the colocalization of LC3B with mitochondria in WT MEFs under basal conditions, as measured by high-resolution confocal imaging. This increase was abolished in Nrf2-/- MEFs. [1] PMI (10 µM, 24 hours) substantially increased the colocalization of P62 with the mitochondrial network in WT MEFs under basal conditions, as measured by confocal imaging. [1] PMI did not induce mitochondrial translocation of Parkin in MEFs, in contrast to the mitochondrial uncoupler FCCP. [1] PMI (10 µM, 24 hours) increased mitochondrial recruitment of LC3 in MEFs with transient Parkin knockdown and in SH-SY5Y cells devoid of PINK1 (pink1 knockout), indicating its action is independent of a fully functional PINK1/Parkin pathway. [1] PMI (10 µM, 24 hours) increased the level of poly-ubiquitination in mitochondrial fractions from MEFs. [1] PMI (10 µM, 24 hours) increased the resting mitochondrial membrane potential (ΔΨm) in MEFs, as measured by TMRM fluorescence. The rate of FCCP-induced depolarization was not affected. [1] PMI (10 µM, 24 hours) moderately increased mitochondrial superoxide production in MEFs (1.24-fold vs control), as measured by mitoSOX fluorescence, but did not alter cytosolic ROS levels measured by dihydroethidium (DHE). [1] |
| Enzyme Assay |
NQO1 Enzymatic Activity Assay: Hepatic1c7 cells were seeded in 96-well plates. After 12 hours, cells were treated with PMI or vehicle (final DMSO 0.1%) and incubated for 24 hours. The culture medium was aspirated and cells were lysed with a buffer containing 0.1% Tween-20 and 2 mM EDTA (pH 7.5). An enzyme reaction mixture containing Tris buffer, BSA, Tween-20, FAD, glucose-6-phosphate (G6P), NADP, G6P dehydrogenase, MTT, and menadione was added to each well. After 5 minutes at room temperature, a stop solution (SDS) was added. The absorbance at 595 nm was measured. Background was corrected using wells without cells. The ratio of optical densities (compound-treated/control) was calculated to determine induction of NQO1 activity. The concentration causing a doubling (CD) of control activity was determined. [1] |
| Cell Assay |
RT-PCR[1] Cell Types: MEF Tested Concentrations: 10 µM Incubation Duration: 9 hrs (hours) Experimental Results: Significant increase in p62 mRNA levels. Immunofluorescence[1] Cell Types: MEF Tested Concentrations: 10 µM Incubation Duration: 24 hrs (hours) Experimental Results: Demonstration that induction of P62 mitochondrial recruitment is Parkin-independent. Western Blot Analysis[1] Cell Types: MEF Tested Concentrations: 10 µM Incubation Duration: 0, 1, 3, 6, 24 hrs (hours) Experimental Results: Nrf2 levels reached maximum after 6 hrs (hours) and remained elevated at 24 hrs (hours). Mitochondrial Membrane Potential (ΔΨm) Measurement: MEFs were loaded with 100 nM TMRM in recording medium for 30 minutes at 37°C. Cells were washed and imaged using a confocal microscope. After recording basal fluorescence, 1 µM FCCP was added to induce depolarization. Mitochondrial regions of interest were selected, and TMRM fluorescence intensities were calculated. [1] Reactive Oxygen Species (ROS) Analysis: For cytosolic ROS, cells were incubated with 5 µM dihydroethidium (DHE) in recording medium for 30 minutes at 37°C. For mitochondrial superoxide, cells were incubated with 5 µM MitoSOX Red under the same conditions. Cells were washed and fluorescence intensity was measured by continuous recording for at least 10 minutes using a confocal microscope. Mitochondrial regions of interest were selected for fluorescence quantification. [1] Subcellular Fractionation (Mitochondrial Isolation): Cells were lysed in cold isotonic sucrose buffer by passing through a needle. Unbroken cells and nuclei were removed by centrifugation at 800 x g for 5 minutes at 4°C. The supernatant was centrifuged at 10,000 x g for 10 minutes at 4°C to pellet mitochondria. The resulting supernatant was collected as the cytosolic fraction. The mitochondrial pellet was washed once in isotonic buffer, recentrifuged, and then lysed in lysis buffer containing Triton X-100. [1] Western Blotting: Protein concentrations were quantified. Equal amounts of protein were resolved by SDS-PAGE and transferred to nitrocellulose membranes. Membranes were blocked and incubated with primary antibodies (e.g., anti-LC3, anti-P62, anti-ubiquitin, anti-parkin, anti-MTCO1, anti-β-actin/tubulin as loading controls) overnight at 4°C. After washing, membranes were incubated with peroxidase-conjugated secondary antibodies. Blots were developed using enhanced chemiluminescence, and band densities were analyzed using ImageJ software. [1] Immunofluorescence and Colocalization Analysis: Cells grown on coverslips were fixed, permeabilized, and blocked. They were incubated overnight at 4°C with primary antibodies (e.g., anti-β-subunit for mitochondria, anti-P62, anti-LC3, anti-parkin) in blocking solution. After washing, cells were incubated with fluorophore-conjugated secondary antibodies. Cells were mounted with DAPI-containing medium. High-resolution confocal images were acquired. The degree of colocalization between markers (e.g., LC3 and mitochondria) was quantified using appropriate software, calculating colocalization coefficients or normalized fluorescence values. [1] Quantitative Real-Time PCR (qRT-PCR): Total RNA was extracted from cultured cells and purified. cDNA was synthesized from 1 µg of total RNA. Gene transcripts (e.g., p62/Sqstm1) were amplified using SYBR Green detection and gene-specific primers on a real-time PCR system. An absolute quantification method was used with a standard curve generated from known amounts of PCR product. The level of gene expression was expressed as a copy number. [1] |
| Toxicity/Toxicokinetics |
No apparent toxic effects on cells were reported at the concentrations used in the assays (e.g., 10 µM). [1] The compound was designed to lack a covalent binding motif, with the aim of having less potential for cytotoxicity compared to covalent Nrf2 inducers like sulforaphane (which is cytotoxic at concentrations above 10 µM in MEFs). [1] |
| References |
[1]. PMI: a ΔΨm independent pharmacological regulator of mitophagy. Chem Biol. 2014 Nov 20;21(11):1585-96. |
| Additional Infomation |
PMI is a pharmacological inducer of mitophagy that acts by upregulating the autophagic adaptor P62 through stabilization of the transcription factor Nrf2, rather than by collapsing the mitochondrial membrane potential. [1] Its mechanism of action is downstream of, and can function independently from, the canonical PINK1/Parkin pathway. [1] PMI represents a prototype tool compound to investigate mitophagy mechanisms without the confounding, nonspecific effects associated with mitochondrial depolarizing agents like FCCP. [1] The chemical name of PMI is 1-(3-iodophenyl)-4-(3-nitrophenyl)-1,2,3-triazole. [1] |
Solubility Data
| Solubility (In Vitro) | DMSO : ~8.33 mg/mL (~21.24 mM) |
| Solubility (In Vivo) |
Solubility in Formulation 1: ≥ 1.25 mg/mL (3.19 mM) (saturation unknown) in 10% DMSO + 40% PEG300 + 5% Tween80 + 45% Saline (add these co-solvents sequentially from left to right, and one by one), clear solution. For example, if 1 mL of working solution is to be prepared, you can add 100 μL of 12.5 mg/mL clear DMSO stock solution to 400 μL PEG300 and mix evenly; then add 50 μL Tween-80 to the above solution and mix evenly; then add 450 μL normal saline to adjust the volume to 1 mL. Preparation of saline: Dissolve 0.9 g of sodium chloride in 100 mL ddH₂ O to obtain a clear solution. Solubility in Formulation 2: ≥ 1.25 mg/mL (3.19 mM) (saturation unknown) in 10% DMSO + 90% Corn Oil (add these co-solvents sequentially from left to right, and one by one), clear solution. For example, if 1 mL of working solution is to be prepared, you can add 100 μL of 12.5 mg/mL clear DMSO stock solution to 900 μL of corn oil and mix evenly. (Please use freshly prepared in vivo formulations for optimal results.) |
| Preparing Stock Solutions | 1 mg | 5 mg | 10 mg | |
| 1 mM | 2.5500 mL | 12.7502 mL | 25.5004 mL | |
| 5 mM | 0.5100 mL | 2.5500 mL | 5.1001 mL | |
| 10 mM | 0.2550 mL | 1.2750 mL | 2.5500 mL |