Physicochemical Properties
| Molecular Formula | C12H16N3O2S+.CL- |
| Molecular Weight | 301.79234 |
| Exact Mass | 266.096 |
| CAS # | 136-16-3 |
| Related CAS # | Oxythiamine chloride hydrochloride;614-05-1 |
| PubChem CID | 8682 |
| Appearance | White to off-white solid powder |
| LogP | 2.335 |
| Hydrogen Bond Donor Count | 2 |
| Hydrogen Bond Acceptor Count | 4 |
| Rotatable Bond Count | 4 |
| Heavy Atom Count | 18 |
| Complexity | 395 |
| Defined Atom Stereocenter Count | 0 |
| InChi Key | SRDGSXVLAVRBLU-UHFFFAOYSA-O |
| InChi Code | InChI=1S/C12H15N3O2S/c1-8-11(3-4-16)18-7-15(8)6-10-5-13-9(2)14-12(10)17/h5,7,16H,3-4,6H2,1-2H3/p+1 |
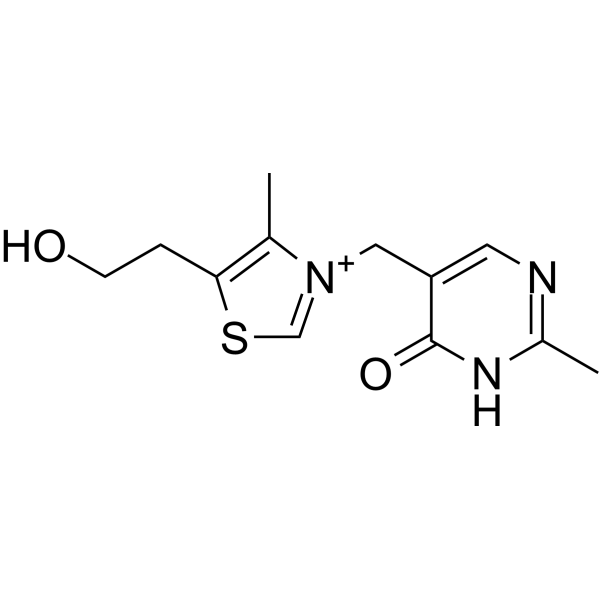
| Chemical Name | 5-[[5-(2-hydroxyethyl)-4-methyl-1,3-thiazol-3-ium-3-yl]methyl]-2-methyl-1H-pyrimidin-6-one |
| HS Tariff Code | 2934.99.9001 |
| Storage |
Powder-20°C 3 years 4°C 2 years In solvent -80°C 6 months -20°C 1 month Note: Please store this product in a sealed and protected environment, avoid exposure to moisture. |
| Shipping Condition | Room temperature (This product is stable at ambient temperature for a few days during ordinary shipping and time spent in Customs) |
Biological Activity
| Targets |
Transketolase (TK) (inhibitor)[1] |
| ln Vitro |
The viability of MIA PaCa-2 cells is inhibited by oxythiamine (0–40 μM, 2 days) (IC50: 14.95 μM)[1]. MIA PaCa-2 cells' ability to proliferate is inhibited by oxythiamine (0-500 μM, 48 hours) (IC50: 14.95 μM)[1]. The proliferation of A549 cells is inhibited by oxythiamine (0.1-100 μM, 6-48 h) [3]. 3 expression of protein/α [1]. A549 cell adapters are sensed by oxythiamine (0.1-100 μM, 24 h) [3]. Lewis lung cancer (LLC) cell minimization and migration are inhibited by oxythiamine (0–20 μM) (IC50: 8.75 μM) [4]. Oxythiamine (OT) exhibited cytotoxic activity against human pancreatic carcinoma cell line MIA PaCa-2, with an IC₅₀ value of 14.95 μM as determined by MTT assay after 2 days of treatment. Treatment of MIA PaCa-2 cells with oxythiamine (5, 50, and 500 μM for 48 h) altered protein expression in a dose-dependent manner. Eighteen differential proteins were identified, of which fourteen were significantly suppressed and four were induced. Examples include suppression of heat shock cognate 71 kDa protein (at spots #2) and induction of heterogeneous nuclear ribonucleoproteins A2/B1. Treatment of MIA PaCa-2 cells with 50 μM oxythiamine over time (0, 12, 48 h) caused dynamic changes in protein expression. Forty-six differential proteins were identified and clustered into three temporal expression patterns: straight down-regulation (Cluster 1, 37%), upright "V" shape (Cluster 2, 47.8%), and downright "V" shape (Cluster 3, 15.2%). Proteins such as peroxiredoxin-6 and annexin A1 (Cluster 1) decreased, while calreticulin (Cluster 3) increased at 12 h then returned to baseline at 48 h. Oxythiamine (50 μM) significantly suppressed the expression of cellular phosphoproteins over time (0, 12, 48 h). Fourteen phosphorylated proteins were identified, with most showing decreased expression. Oxythiamine (50 μM) interrupted the de novo protein synthesis rates in MIA PaCa-2 cells. The synthesis rate of annexin A1 was reduced from 55% (control at 48 h) to 37% after 48 h of OT treatment. For several other proteins (e.g., endoplasmin, heat shock cognate 71 kDa protein), synthesis rates were also decreased at 48 h compared to control. Western blot validation confirmed dose-dependent effects: alpha-enolase expression increased, while 14-3-3 protein beta/alpha decreased with increasing OT concentration (5, 50, 500 μM). Time-dependent effects were also confirmed for peroxiredoxin-6, annexin A1, calreticulin, and heterogeneous nuclear ribonucleoproteins A2/B1. Pathway analysis of the 52 differential proteins suggested their involvement in cell death signaling, gene expression, post-translational modification, and diseases including cancer. Annexin A1 expression was significantly higher in serum samples from pancreatic cancer patients (n=7) compared to healthy volunteers (n=12), as measured by Western blot.[1] |
| ln Vivo |
In mice with Ehrlich ascites tumors, oxythiamine (100–500 mg/kg, intraperitoneally for 4 days) reduces the formation of tumors [2]. For five weeks, oxythiamine (250 or 500 mg/kg once daily) was administered via inhibition ring. In Ehrlich's ascites tumor-bearing mice, daily intraperitoneal administration of oxythiamine (OT) for 4 days inhibited tumor growth in a dose-dependent manner (100-500 mg/kg/day). At 300 mg/kg/day, OT inhibited tumor growth by 43%. At 500 mg/kg/day, inhibition reached 84%. Flow cytometric analysis of tumor cells from treated mice revealed that oxythiamine induced a dose-dependent G₀-G₁ phase cell cycle arrest. The percentage of cells in G₀-G₁ phase increased approximately 1.5-fold at higher doses, while the percentage of cells in S and G₂-M phases decreased simultaneously. Oxythiamine (500 mg/kg/day) did not induce apoptotic cell death in Ehrlich's tumor cells, as assessed by flow cytometry and fluorescent microscopy. Cell viability remained over 95% in all treatment groups. Combination therapy of oxythiamine with dehydroepiandrosterone (DHEA, another pentose cycle inhibitor) showed synergistic effects on tumor growth inhibition. For example, OT (400 mg/kg/day) and DHEA (300 mg/kg/day) alone caused ~46% and ~45% inhibition, respectively, while their combination led to 86.4% inhibition. The highest combined dose (OT 500 mg/kg/day + DHEA 400 mg/kg/day) achieved 94.3% growth inhibition. Combined treatment also resulted in a more pronounced change in cell cycle distribution, significantly reducing the cell population in the G₂-M phase.[2] |
| Cell Assay |
Cell Viability Assay[1] Cell Types: MIA PaCa-2 cells Tested Concentrations: 0-40 μM Incubation Duration: 2 days Experimental Results: Inhibits cell viability, IC50 is 14.95 μM. Western Blot Analysis [1] Cell Types: MIA PaCa-2 cells Tested Concentrations: 0, 5, 50, 500 μM Incubation Duration: 48 hrs (hours) Experimental Results: Inhibited 14-3-3 protein β/α expression and increased α-enolase . Cytotoxicity Assay (MTT): MIA PaCa-2 cells in exponential phase were dispensed into 96-well plates at a density of 1×10⁴ cells per well. Cells were treated with different concentrations of oxythiamine for 2 days. Then, 20 μL of MTT reagent was added to each well and incubated at 37°C for 4 hours. After incubation, the formed formazan crystals were solubilized by adding 100 μL of dimethyl sulfoxide to each well and incubating for 10 minutes. The absorbance of each well was measured at 490 nm using a microplate reader. Cell viability and IC₅₀ were calculated. Proteomic Sample Preparation for 2D-Gel Analysis: MIA PaCa-2 cells were treated with oxythiamine under dose-dependent (0, 5, 50, 500 μM for 48 h) or time-dependent (50 μM for 0, 12, 48 h) conditions. Cell pellets were washed with ice-cold PBS and harvested in lysis buffer containing protease and phosphatase inhibitors. The suspension was sonicated and centrifuged. Protein concentration was determined by Bradford assay. Two-Dimensional Gel Electrophoresis (2-DE): 500 μg of protein samples were mixed with rehydration buffer and loaded onto IPG strips (pH 3-10 NL). Isoelectric focusing was performed using a stepwise voltage protocol. After IEF, strips were equilibrated and placed onto 8-16% Tris-HCl gels for second-dimension SDS-PAGE. Gels were stained with SYPRO Ruby or Coomassie Blue, scanned, and analyzed using software for spot detection, quantification, and matching. Protein spots showing >2-fold difference with statistical significance (p<0.05) were excised for mass spectrometry analysis. Phosphoprotein Detection: After 2-DE, gels were specifically stained with Pro-Q Diamond phosphoprotein stain to visualize phosphorylated proteins before subsequent total protein staining. In-Gel Trypsin Digestion and MALDI-TOF/TOF MS: Excised gel spots were destained, dried, and digested with trypsin at 37°C for 20 hours. Peptides were extracted, cleaned, mixed with matrix, and spotted onto a target plate for analysis by MALDI-TOF/TOF mass spectrometer. Peptide mass fingerprinting and MS/MS sequencing were performed, and data were searched against protein databases using Mascot. Protein Synthesis Rate Measurement (mSILAC): For time-dependent studies, MIA PaCa-2 cells were cultured in medium containing a 50% mixture of ¹⁵N-labeled algal amino acids as tracers, with or without 50 μM oxythiamine, for 12 and 48 hours. The isotopomer distribution of peptides from differentially expressed proteins was analyzed by MALDI-TOF/TOF MS. The fraction of new protein synthesis and protein turnover rates were calculated based on the shift in mass spectra between ¹⁴N- and ¹⁵N-labeled peptides using in-house algorithms and multiple linear regression analysis. Western Blot Analysis: Protein samples were separated by SDS-PAGE and transferred to PVDF membranes. Membranes were blocked, incubated with primary antibodies, followed by appropriate secondary antibodies conjugated with horseradish peroxidase. Protein bands were visualized using enhanced chemiluminescence reagent. Band intensities were quantified using imaging software and normalized to loading controls (β-actin or β-tubulin). This method was used to validate 2-DE results and to measure Annexin A1 levels in human serum samples.[1] |
| Animal Protocol |
Animal/Disease Models: Ehrlich ascites tumor host mouse [2] Doses: 100-500 mg/kg Route of Administration: intraperitoneal (ip) injection, 4-day Experimental Results: Inhibition of tumor growth was 43% at 300 mg/kg and 84% at 500 mg/kg. Tumor Model: Ehrlich's ascites tumor cells were maintained in C57BL/6S mice and transplanted weekly by intraperitoneal aspiration and inoculation. For experiments, 20×10⁶ tumor cells per mouse were injected intraperitoneally. Drug Treatment: Treatment began 4 days after tumor implantation. Oxythiamine was dissolved in Dulbecco's phosphate-buffered saline to prepare a 500 mg/ml stock solution, which was then diluted to the required concentrations. The drug was administered via daily intraperitoneal injections for 4 days (or prolonged for up to 2 weeks in a toxicity study) at doses ranging from 100 to 500 mg/kg of mouse body weight per day. Combination Therapy: For combination studies, oxythiamine and DHEA were administered together via intraperitoneal injection. DHEA was dissolved in a 60% dimethyl sulfoxide (DMSO)-Dulbecco's phosphate-buffered saline mixture. Control: Control animals received the vehicle (maximum concentration of DMSO-Dulbecco's phosphate-buffered saline mixture) for the same duration. Endpoint Measurements: Tumor volume and total cell number were measured post-mortem using a calibrated syringe after aspiration. Cell cycle phase distribution, viability, and apoptosis were analyzed by flow cytometry and fluorescent microscopy on fresh tumor cell samples.[2] |
| Toxicity/Toxicokinetics |
No direct cell toxicity was observed: tumor cell viability remained over 95% in all oxythiamine-treated groups, and no signs of apoptotic cell death were induced by the drug. No host toxicity was observed: Treated mice showed no change in behavior, daily food/water consumption, physical activity, or signs of distress during the 4-day or prolonged (2-week) treatment periods. Body weight gain in tumor-bearing mice was less than controls, attributable to inhibited tumor growth. Histopathological examination of vital tissues (liver, heart, kidney) from mice treated with oxythiamine (up to 400 mg/kg/day) showed no signs of toxicity compared to controls.[2] |
| References |
[1]. Inhibition of transketolase by oxythiamine altered dynamics of protein signals in pancreatic cancer cells. Exp Hematol Oncol. 2013 Jul 27;2:18. [2]. Oxythiamine and dehydroepiandrosterone induce a G1 phase cycle arrest in Ehrlich's tumor cells through inhibition of the pentose cycle. FEBS Lett. 1999 Jul 30;456(1):113-8. [3]. A dose- and time-dependent effect of oxythiamine on cell growth inhibition in non-small cell lung cancer. Cogn Neurodyn. 2022 Jun;16(3):633-641. [4]. The in vitro and in vivo anti-metastatic efficacy of oxythiamine and the possible mechanisms of action. Clin Exp Metastasis. 2010 May;27(5):341-9. |
| Additional Infomation |
Oxythiamine(1+) is a 1,3-thiazolium cation that is 5-(2-hydroxyethyl)-4-methyl-1,3-thiazole alkylated at the N3 position by a (2-methyl-4-oxo-1,4-dihydropyrimidin-5-yl)methyl group. It has a role as an antimetabolite and a vitamin B1 antagonist. Thiamine antagonist, antimetabolite. Oxythiamine (OT) is a thiamine antagonist and an anti-metabolite. It inhibits transketolase (TK), a key enzyme in the non-oxidative branch of the pentose phosphate pathway. This inhibition suppresses ribose synthesis and the production of coenzymes like ATP, NAD(P)+, impacting the synthesis of RNA and DNA in cancer cells. The study proposes that oxythiamine exerts its anti-tumor effects by altering the dynamics of protein expression and interrupting de novo protein synthesis rates in pancreatic cancer cells, leading to cell cycle arrest and apoptosis. The dynamic proteomic approach used in this study suggests that inhibiting a single metabolic enzyme (transketolase) can alter multiple cellular signaling pathways associated with cell survival and death.[1] Oxythiamine (OT) is a thiamine antagonist and inhibitor of the non-oxidative reactions of the pentose phosphate pathway, specifically targeting transketolase. The study proposes that oxythiamine exerts its anti-tumor effect by limiting the synthesis of pentose phosphates (ribose), which are crucial for nucleic acid (RNA/DNA) production, thereby arresting tumor cells in the G₁ phase of the cell cycle and inhibiting proliferation. Unlike 2-deoxyglucose, oxythiamine is suggested to selectively inhibit anabolic pathways for nucleic acid synthesis without significantly affecting glycolysis and cellular energy production, potentially reducing toxicity to normal tissues. The G₁ phase arrest induced by oxythiamine may help synchronize cancer cells, potentially increasing the efficacy of other G₁ phase-specific chemotherapeutic agents.[2] |
Solubility Data
| Solubility (In Vitro) | DMSO : ~51.67 mg/mL (~194.00 mM) |
| Solubility (In Vivo) |
Solubility in Formulation 1: ≥ 2.58 mg/mL (9.69 mM) (saturation unknown) in 10% DMSO + 40% PEG300 + 5% Tween80 + 45% Saline (add these co-solvents sequentially from left to right, and one by one), clear solution. For example, if 1 mL of working solution is to be prepared, you can add 100 μL of 25.8 mg/mL clear DMSO stock solution to 400 μL PEG300 and mix evenly; then add 50 μL Tween-80 to the above solution and mix evenly; then add 450 μL normal saline to adjust the volume to 1 mL. Preparation of saline: Dissolve 0.9 g of sodium chloride in 100 mL ddH₂ O to obtain a clear solution. Solubility in Formulation 2: ≥ 2.58 mg/mL (9.69 mM) (saturation unknown) in 10% DMSO + 90% (20% SBE-β-CD in Saline) (add these co-solvents sequentially from left to right, and one by one), clear solution. For example, if 1 mL of working solution is to be prepared, you can add 100 μL of 25.8 mg/mL clear DMSO stock solution to 900 μL of 20% SBE-β-CD physiological saline solution and mix evenly. Preparation of 20% SBE-β-CD in Saline (4°C,1 week): Dissolve 2 g SBE-β-CD in 10 mL saline to obtain a clear solution. Solubility in Formulation 3: ≥ 2.58 mg/mL (9.69 mM) (saturation unknown) in 10% DMSO + 90% Corn Oil (add these co-solvents sequentially from left to right, and one by one), clear solution. For example, if 1 mL of working solution is to be prepared, you can add 100 μL of 25.8 mg/mL clear DMSO stock solution to 900 μL of corn oil and mix evenly. (Please use freshly prepared in vivo formulations for optimal results.) |
| Preparing Stock Solutions | 1 mg | 5 mg | 10 mg | |
| 1 mM | 3.3136 mL | 16.5678 mL | 33.1356 mL | |
| 5 mM | 0.6627 mL | 3.3136 mL | 6.6271 mL | |
| 10 mM | 0.3314 mL | 1.6568 mL | 3.3136 mL |