Physicochemical Properties
| Molecular Formula | C₃₈H₄₄N₂O₆ |
| Molecular Weight | 624.77 |
| Exact Mass | 624.319 |
| Elemental Analysis | C, 73.05; H, 7.10; N, 4.48; O, 15.36 |
| CAS # | 2292-16-2 |
| Related CAS # | 2292-16-2 |
| PubChem CID | 159654 |
| Appearance | White to yellow solid powder |
| Density | 1.2±0.1 g/cm3 |
| Boiling Point | 710.9±60.0 °C at 760 mmHg |
| Flash Point | 383.8±32.9 °C |
| Vapour Pressure | 0.0±2.4 mmHg at 25°C |
| Index of Refraction | 1.601 |
| LogP | 5.49 |
| Hydrogen Bond Donor Count | 1 |
| Hydrogen Bond Acceptor Count | 8 |
| Rotatable Bond Count | 10 |
| Heavy Atom Count | 46 |
| Complexity | 933 |
| Defined Atom Stereocenter Count | 2 |
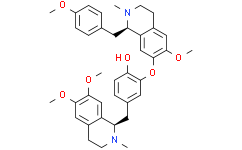
| SMILES | O(C1=C(C([H])=C([H])C(=C1[H])C([H])([H])[C@]1([H])C2=C([H])C(=C(C([H])=C2C([H])([H])C([H])([H])N1C([H])([H])[H])OC([H])([H])[H])OC([H])([H])[H])O[H])C1=C(C([H])=C2C([H])([H])C([H])([H])N(C([H])([H])[H])[C@]([H])(C([H])([H])C3C([H])=C([H])C(=C([H])C=3[H])OC([H])([H])[H])C2=C1[H])OC([H])([H])[H] |
| InChi Key | MIBATSHDJRIUJK-ROJLCIKYSA-N |
| InChi Code | InChI=1S/C38H44N2O6/c1-39-15-14-27-21-36(44-5)38(23-30(27)31(39)17-24-7-10-28(42-3)11-8-24)46-34-19-25(9-12-33(34)41)18-32-29-22-37(45-6)35(43-4)20-26(29)13-16-40(32)2/h7-12,19-23,31-32,41H,13-18H2,1-6H3/t31-,32-/m1/s1 |
| Chemical Name | 4-[[(1R)-6,7-dimethoxy-2-methyl-3,4-dihydro-1H-isoquinolin-1-yl]methyl]-2-[[(1R)-6-methoxy-1-[(4-methoxyphenyl)methyl]-2-methyl-3,4-dihydro-1H-isoquinolin-7-yl]oxy]phenol |
| Synonyms | (-)-Neferine; Neferine; (R)-1,2-Dimethoxyaporphine |
| HS Tariff Code | 2934.99.9001 |
| Storage |
Powder-20°C 3 years 4°C 2 years In solvent -80°C 6 months -20°C 1 month Note: This product requires protection from light (avoid light exposure) during transportation and storage. |
| Shipping Condition | Room temperature (This product is stable at ambient temperature for a few days during ordinary shipping and time spent in Customs) |
Biological Activity
| Targets |
p65; Autophagy Neferine targets nuclear factor kappa-B (NF-κB) (inhibits NF-κB nuclear translocation) [1][2] |
| ln Vitro |
Neferine inhibits COX-2 expression and hypoxia-induced NF-B p65 nuclear translocation[1]. In cardiac fibroblasts, neferine inhibits the activation of TGF-1-Smad, ERK, and p38 MAPK signaling as well as the production of collagen that is caused by high glucose. In HG medium with varying concentrations of neferine (1, 2, or 5 μM), cardiac fibroblasts (CFs) are cultured. There are three different time points (24, 48, and 72 h) for CCK-8 assays. High glucose (30 mM) treatment significantly accelerates the proliferation of CFs in a time-dependent manner when compared to normal glucose (NG) and osmotic control (OC) treatments (P<0.05). When compared to vehicle treatment, neferine treatment at either 2 or 5 μM significantly reduces the HG-induced CF proliferation. Neferine does not, however, prevent the proliferation of CFs brought on by HG at 1 μM. Therefore, the remaining experiments employ 2 and 5 μM Neferine[2]. - Protection against hypoxia-induced oxidative stress and apoptosis in muscle cells: Neferine (5 μM, 10 μM, 20 μM) pre-treated C2C12 myoblasts for 2 hours before hypoxia exposure (1% O₂, 24 hours) dose-dependently improved cell viability. At 20 μM, cell viability increased from 45% (hypoxia group) to 82%, reactive oxygen species (ROS) production reduced by 70%, and apoptotic rate decreased from 38% to 8%. It inhibited NF-κB p65 nuclear translocation (reduced by 65% at 20 μM) and downregulated pro-apoptotic proteins (Bax/Bcl-2 ratio reduced by 72%, cleaved caspase-3 expression inhibited by 68% at 20 μM) [1] - Inhibition of high glucose-induced proliferation and collagen synthesis in cardiac fibroblasts: Neferine (2.5 μM, 5 μM, 10 μM) treated cardiac fibroblasts exposed to high glucose (30 mM) for 48 hours suppressed cell proliferation. At 10 μM, proliferation inhibition rate was 58%, and collagen I/III synthesis was reduced (mRNA levels decreased by 62% and 55% respectively). It downregulated TGF-β1 (protein level reduced by 60% at 10 μM) and phosphorylated Smad3 (p-Smad3, inhibition rate 58% at 10 μM) [2] |
| ln Vivo |
Low-dose (60 mg/kg/day, gavage) and high-dose (120 mg/kg/day, gavage) lisinine therapy can inhibit hyperglycemia-induced production of type I and III collagen and TGF-β1 proteins. Add[2]]. - Reduction of cardiac fibrosis in diabetic mice: In streptozotocin (STZ)-induced diabetic mice, intraperitoneal administration of Neferine (20 mg/kg, once daily for 8 weeks) significantly improved cardiac fibrosis. Myocardial collagen deposition was reduced by 60% compared to diabetic control, and protein levels of TGF-β1, p-Smad3, collagen I, and collagen III were decreased by 55%, 58%, 48%, and 42% respectively. No significant effect on blood glucose levels was observed [2] |
| Cell Assay |
Cardiac fibroblasts (CFs) are extracted from the ventricular tissues of newborn mice. After starvation in serum-free medium for 24 h, CFs are incubated in DMEM containing 5.6 mM glucose (normal glucose; NG), 30 mM D-glucose (HG), 30 mM D-glucose plus 1 μM Neferine, 30 mM D-glucose plus 2 μM Neferine, 30 mM D-glucose plus 5 μM Neferine, and 5.6 mM glucose plus 27.5 mM mannose. Cells are removed after 24, 48, and 72 hours. The Cell-LightTM EdU assay and the Cell Counting Kit-8 (CCK-8) are used to measure cell proliferation[2]. - Hypoxia-induced muscle cell injury assay: C2C12 myoblasts were seeded into 96-well plates (5×10³ cells/well) or 6-well plates (for western blot/immunofluorescence) and incubated overnight. Cells were pre-treated with Neferine (5-20 μM) for 2 hours, then exposed to hypoxic conditions (1% O₂) for 24 hours. Cell viability was measured by tetrazolium salt assay; ROS levels were detected by fluorescent probe; apoptosis was analyzed by Annexin V-FITC/PI staining and flow cytometry. NF-κB p65 subcellular localization was observed by immunofluorescence, and protein levels of Bax, Bcl-2, cleaved caspase-3, and NF-κB pathway components were detected by western blot [1] - High glucose-induced cardiac fibroblast assay: Cardiac fibroblasts were seeded into 96-well plates (for proliferation) or 6-well plates (for PCR/western blot) and cultured overnight. Cells were treated with high glucose (30 mM) and Neferine (2.5-10 μM) for 48 hours. Cell proliferation was measured by tetrazolium salt assay; collagen synthesis was evaluated by RT-PCR (collagen I/III mRNA) and western blot (collagen protein levels). TGF-β1 and p-Smad3 expression was detected by western blot [2] |
| Animal Protocol |
Mice: Male C57BL/6J mice that are eight weeks old are used. Streptozotocin dissolved in citrate buffer (pH 4.5) is injected intraperitoneally for five days straight to induce diabetes. Only citrate buffer is injected into control mice. An Accu-Check Active glucometer is used to measure the total blood sugar in mouse tail blood. Mice that had blood glucose levels greater than 18 mM were categorized as diabetic and used in this study. Four groups of eight animals each are created at random from the total number of animals. Three groups of diabetic mice are used: group 1, the diabetic control group (DM); group 2, which receives neferine at a dose of 60 mg/kg/day (DM-NL); and group 3, which receives neferine at a dose of 120 mg/kg/day (DM-NH). For 12 weeks, neferine is given by intragastric gavage twice per day. The normal and DM control groups receive equivalent amounts of normal sodium via gavage. At the conclusion of the 12-week treatment period, mice are anesthetized and sacrificed[2]. - Diabetic cardiac fibrosis model: Male C57BL/6 mice were intraperitoneally injected with STZ to induce diabetes (blood glucose > 16.7 mmol/L). After successful modeling, mice were randomly divided into diabetic control group and Neferine treatment group (n=8 per group). Neferine was dissolved in physiological saline and administered intraperitoneally at 20 mg/kg once daily for 8 weeks; the control group received equal volume of physiological saline. At the end of treatment, mice were sacrificed, hearts were excised, and myocardial tissues were collected for histological staining (Masson's trichrome) to assess collagen deposition and western blot analysis of TGF-β1, p-Smad3, and collagen proteins [2] |
| References |
[1]. Neferine prevents NF-κB translocation and protects muscle cells from oxidative stress and apoptosis induced by hypoxia. Biofactors. 2016 Jul 8;42(4):407-17. [2]. Neferine inhibits proliferation and collagen synthesis induced by high glucose in cardiac fibroblasts and reduces cardiac fibrosis in diabetic mice. Oncotarget. 2016 Sep 20;7(38):61703-61715. |
| Additional Infomation |
Neferine is a member of isoquinolines. Neferine has been reported in Nelumbo nucifera with data available. - Natural source: Neferine is a bisbenzylisoquinoline alkaloid isolated from the embryo of Nelumbo nucifera Gaertn. (lotus seed embryo) [1][2] - Mechanism of action: Neferine exerts protective effects by inhibiting NF-κB nuclear translocation to reduce oxidative stress and apoptosis in hypoxic muscle cells [1]; it suppresses high glucose-induced cardiac fibroblast proliferation and collagen synthesis via downregulating the TGF-β1/Smad3 signaling pathway, thereby alleviating cardiac fibrosis [2] - Therapeutic potential: It shows promising protective effects against hypoxia-induced muscle cell injury and diabetic cardiac fibrosis, with potential applications in treating related cardiovascular and muscle disorders [1][2] |
Solubility Data
| Solubility (In Vitro) | DMSO: 100~125 mg/mL (160.1~200.1 mM) |
| Solubility (In Vivo) |
Solubility in Formulation 1: ≥ 2.08 mg/mL (3.33 mM) (saturation unknown) in 10% DMSO + 40% PEG300 + 5% Tween80 + 45% Saline (add these co-solvents sequentially from left to right, and one by one), clear solution. For example, if 1 mL of working solution is to be prepared, you can add 100 μL of 20.8 mg/mL clear DMSO stock solution to 400 μL PEG300 and mix evenly; then add 50 μL Tween-80 to the above solution and mix evenly; then add 450 μL normal saline to adjust the volume to 1 mL. Preparation of saline: Dissolve 0.9 g of sodium chloride in 100 mL ddH₂ O to obtain a clear solution. Solubility in Formulation 2: ≥ 2.08 mg/mL (3.33 mM) (saturation unknown) in 10% DMSO + 90% Corn Oil (add these co-solvents sequentially from left to right, and one by one), clear solution. For example, if 1 mL of working solution is to be prepared, you can add 100 μL of 20.8 mg/mL clear DMSO stock solution to 900 μL of corn oil and mix evenly. (Please use freshly prepared in vivo formulations for optimal results.) |
| Preparing Stock Solutions | 1 mg | 5 mg | 10 mg | |
| 1 mM | 1.6006 mL | 8.0029 mL | 16.0059 mL | |
| 5 mM | 0.3201 mL | 1.6006 mL | 3.2012 mL | |
| 10 mM | 0.1601 mL | 0.8003 mL | 1.6006 mL |