Physicochemical Properties
| Molecular Formula | C39H46I3N2P |
| Molecular Weight | 954.483128070831 |
| Exact Mass | 954.053 |
| Elemental Analysis | C, 49.08; H, 4.86; I, 39.89; N, 2.93; P, 3.25 |
| CAS # | 1821370-28-8 |
| PubChem CID | 129909777 |
| Appearance | Brown to reddish brown solid powder |
| Hydrogen Bond Donor Count | 0 |
| Hydrogen Bond Acceptor Count | 3 |
| Rotatable Bond Count | 15 |
| Heavy Atom Count | 45 |
| Complexity | 646 |
| Defined Atom Stereocenter Count | 0 |
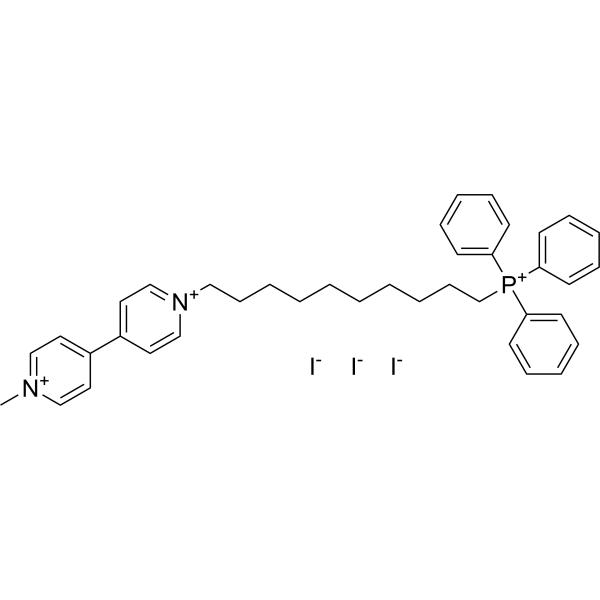
| SMILES | [I-].[I-].[I-].[P+](C1C=CC=CC=1)(C1C=CC=CC=1)(C1C=CC=CC=1)CCCCCCCCCC[N+]1C=CC(C2C=C[N+](C)=CC=2)=CC=1 |
| InChi Key | AOZZGHKENAZYTD-UHFFFAOYSA-K |
| InChi Code | InChI=1S/C39H46N2P.3HI/c1-40-30-25-35(26-31-40)36-27-32-41(33-28-36)29-17-6-4-2-3-5-7-18-34-42(37-19-11-8-12-20-37,38-21-13-9-14-22-38)39-23-15-10-16-24-39;;;/h8-16,19-28,30-33H,2-7,17-18,29,34H2,1H3;3*1H/q+3;;;/p-3 |
| Chemical Name | 10-[4-(1-methylpyridin-1-ium-4-yl)pyridin-1-ium-1-yl]decyl-triphenylphosphanium;triiodide |
| Synonyms | MitoPQ; 1821370-28-8; 1-Methyl-1'-(10-(triphenylphosphonio)decyl)-[4,4'-bipyridine]-1,1'-diium iodide; 10-[4-(1-methylpyridin-1-ium-4-yl)pyridin-1-ium-1-yl]decyl-triphenylphosphanium;triiodide; MitoParaquat; MitoPQ, MitoParaquat.; CHEMBL4750332; WXC37028; |
| HS Tariff Code | 2934.99.9001 |
| Storage |
Powder-20°C 3 years 4°C 2 years In solvent -80°C 6 months -20°C 1 month Note: Please store this product in a sealed and protected environment, avoid exposure to moisture. |
| Shipping Condition | Room temperature (This product is stable at ambient temperature for a few days during ordinary shipping and time spent in Customs) |
Biological Activity
| Targets | Mitochondrial (mitochondria)-targeted redox cycling agent |
| ln Vitro |
MitoPQ is accumulated by energized mitochondria [1] To enhance superoxide production in mitochondria over PQ, the newly developed compounds have to accumulate rapidly within the matrix in response to the membrane potential (Fig. 1). Therefore we next measured their uptake by energized mitochondria (Fig. 5). After incubation with MitoPQ and TPMP, mitochondria were pelleted and assessed by RP-HPLC, showing extensive uptake of both MitoPQ and TPMP, which was decreased by the uncoupler FCCP (Fig. 5A). To quantify uptake, we also measured the accumulation ratio (ACR), that is the relative amounts of the compounds in the mitochondria and supernatant. Both TPMP and MitoPQ had substantial ACRs which were decreased by FCCP (Fig. 5B). Assessment of the other compounds in the same way showed that DMV, DBipy, and the TPP-conjugated derivative Mito(C10)Bipy were all accumulated by energized mitochondria (Fig. 5B). Interestingly, while MitoPQ and Mito(C10)Bipy were taken up, MitoPQC4 and Mito(C4)Bipy were not, consistent with uptake requiring the hydrophobicity provided by the ten carbon linker to counteract the polar viologen or monalkyl bipyridine moiety. MitoPQ stimulates hydrogen peroxide production by isolated mitochondria [1] We next investigated whether the compounds taken up by energized mitochondria could initiate redox cycling within the matrix. MitoPQ significantly increased hydrogen peroxide production, the product of superoxide dismutation, from heart mitochondria (Fig. 6A). When this analysis was extended to the other compounds it showed that, as expected, similar concentrations of PQ were ineffective and that DBipy was the only other compound to increase hydrogen peroxide efflux, albeit to a smaller extent than for MitoPQ (Fig. S1). Therefore, MitoPQ was by far the most effective generator of hydrogen peroxide by isolated mitochondria, presumably due to its membrane potential-dependent accumulation (Fig. 5) and its redox cycling at complex I (Fig. 4). Consequently we focused on further characterizing ROS production by MitoPQ. MitoPQ was several hundred-fold more potent than PQ at inducing hydrogen peroxide production from isolated mitochondria (Fig. 6B) and this hydrogen peroxide production was eliminated by preventing MitoPQ uptake with FCCP (Fig. 6C). To assess superoxide formation by MitoPQ more directly within mitochondria, we measured inactivation of the superoxide-sensitive matrix enzyme aconitase. MitoPQ was several hundred-fold more potent at decreasing aconitase activity than PQ (Fig. 6D), and this inactivation was prevented by FCCP (Fig. 6E). We next monitored the relative amounts of monomeric and dimeric forms of peroxiredoxin 3 (Prdx3). This mitochondrial matrix antioxidant enzyme scavenges hydrogen peroxide to form a disulfide-bonded dimer, with the proportion in the monomeric form decreasing as mitochondrial hydrogen peroxide increases. MitoPQ, but not PQ, caused the disappearance of monomeric Prdx3, consistent with increased matrix hydrogen peroxide, and this was prevented by FCCP (Fig. 6F). Together, these data support the accumulation of MitoPQ by energized mitochondria driving superoxide production within the matrix by redox cycling at complex I. MitoPQ increases mitochondrial superoxide production within cells [1] To see whether MitoPQ could stimulate superoxide production within mitochondria in cells, we used the increase of fluorescence of MitoSOX, which responds to elevated superoxide and hydrogen peroxide in the mitochondrial matrix. MitoPQ increased MitoSOX fluorescence (Fig. 7A), and this oxidation increased over time (Fig. 7B). In contrast, PQ was unable to increase MitoSOX oxidation over this timescale, even at a thousand times greater concentration than used for MitoPQ (Fig. 7C). MitoPQ treatment for 6 h decreased aconitase activity, while the same concentration of PQ had no effect (Fig. 7D), also consistent with MitoPQ increasing superoxide production within mitochondria in cells. To further assess MitoPQ superoxide production within mitochondria in cells, we measured MnSOD expression levels, which increases as an adaptation to elevated matrix superoxide. MitoPQ increased MnSOD protein levels in a time- and dose-dependent manner, reaching a maximal induction of ~2-fold at 12 h (Fig. S2). Quantification by scanning densitometry showed that 1–5 µM MitoPQ increased MnSOD expression, while a thousand-fold higher PQ concentration was required to enhance expression to the same extent (Fig. 7E). Higher concentrations of MitoPQ decreased MnSOD protein levels, presumably due to mitochondrial damage by excessive superoxide production (Fig. 7E). This toxic effect of MitoPQ was confirmed by measuring cell viability, which showed that MitoPQ increased cell death, while several hundred-fold higher concentrations of PQ were required to generate comparable toxicity (Fig. 7F and Fig. S3). Together these data indicate that MitoPQ accumulates selectively within mitochondria in cells to generate superoxide that induces biological responses to elevated superoxide and, at higher concentrations, causes cell death. |
| ln Vivo |
MitoPQ disrupts mitochondrial function in the isolated perfused heart [1] We next assessed the effects of MitoPQ on the function of the isolated perfused heart. For this, we perfused beating mouse hearts in isovolumic Langendorff mode and functional parameters (systolic pressure, end diastolic pressure, coronary flow and perfusion pressure) were recorded throughout (Fig. 8A-C). Preliminary experiments showed that prolonged perfusion with 500 µM PQ was required to see toxic effects, while 5 µM MitoPQ was mildly damaging, therefore we assessed the effects of 50 µM MitoPQ in detail. After equilibration, hearts were randomized for perfusion with 50 µM MitoPQ, PQ, or TPMP (as a control for non-specific effects of lipophilic cations). MitoPQ decreased LVDP (Fig. 8A), increased end diastolic pressure (Fig. 8B) and decreased coronary flow (Fig. 8C), with no change in heart rate (data not shown). In contrast, the same concentrations of PQ or TPMP had no effect (Fig. 8A-C). These data are consistent with MitoPQ being far more damaging to heart function than PQ. This heart damage is due to its selective uptake by mitochondria within the heart and subsequent oxidative damage to the organelles leading to cell death and disruption to heart function. MitoPQ is toxic to flies in vivo [1] To extend our study to whole organisms, we exposed wild-type Drosophila melanogaster to a single bolus of PQ or MitoPQ via microinjection, and monitored their survival (Fig. 9D). Over a range of concentrations, MitoPQ treatment was significantly more toxic to the flies than PQ (Fig. 8D). These data confirm that selective targeting of MitoPQ to mitochondria enhances toxicity relative to PQ in vivo. |
| Cell Assay |
Western blotting [1] For peroxiredoxin 3 detection, RHM (2 mg protein/mL) were incubated for 3 min at 30 °C in KCl buffer respiring on 5 mM glutamate/malate, supplemented with MitoPQ, PQ or vehicle control. At the end of the incubation 100 mM N-ethylmaleimide (NEM) was added and the incubation continued for a further 5 min. Mitochondria were then pelleted by centrifugation (7500 x g, 3 min) and the pellet re-suspended in loading buffer lacking reductant and 20 µg protein separated on a non-reducing 12% SDS-PAGE gel. Proteins were then transferred to a PVDF membrane using a BioRad TurboBlot transfer apparatus. Equal protein loading and transfer were verified with Memcode reversible protein stain following the manufacturer's protocol (Pierce Biotechnology). Membranes were blocked with Odyssey Blocking Buffer for 2 h at room temperature. Incubation with anti-peroxiredoxin 3 (Prdx3; rabbit polyclonal; 1:1000 v/v dilution) was performed overnight at 4 °C. |
| Animal Protocol |
Isolated perfused mouse heart experiments [1] C57BL/6J male mice (~25 g) were kept in individually ventilated cages with a 12 h light-dark cycle, controlled humidity and temperature (20–22 °C), fed standard chow and water ad libitum. Mice were administered terminal anesthesia via intra-peritoneal pentobarbitone injection (~140 mg/kg body weight). Beating hearts were rapidly excised, cannulated and perfused in isovolumic Langendorff mode at 80 mm Hg pressure maintained by a STH peristaltic pump controller feedback system, with Krebs-Henseleit (KH) buffer continuously gassed with 95% O2/5% CO2 (pH 7.4, 37 °C) containing (in mM): NaCl 116, KCl 4.7, MgSO.7H2O 1.2, NaHCO3 25, KH2PO4 1.2, CaCl2 1.4, glucose 11. Hearts were continuously paced at ~550 bpm and cardiac function was assessed using a fluid-filled cling-film balloon inserted into left ventricle (LV) connected via a line to a pressure transducer and a Powerlab system (AD Instruments, UK). The volume of the intraventricular balloon was adjusted using a 1.0 mL syringe to achieve an initial LV diastolic pressure (LVDP) of 4–9 mmHg. Functional parameters (systolic pressure, end diastolic pressure, heart rate, coronary flow, perfusion pressure) were recorded using LabChart software v.7 (AD Instruments, UK) throughout the experiment. LVDP was calculated from the difference between systolic (SP) and diastolic pressures (DP). After 20 min equilibration, hearts were randomized into three groups (n=6 in each group) for a further 20 min treatment with: 50 μM PQ, MitoPQ or TPMP in the perfusate. At the end of all perfusion protocols, hearts were immediately snap frozen using Wollenberger tongs pre-cooled in liquid nitrogen and stored at–80 °C until further analysis. Drosophila maintenance and experiments [1] Wild-type Drosophila melanogaster (white Dahomey stock) were maintained on standard sugar-yeast-agar medium at 25 °C, 65% humidity on a 12:12 h light:dark cycle. Experimental flies were raised at constant density from a synchronized egg collection. 7 day old females were microinjected under gentle CO2 anesthesia using a PicoSpritzer III (Parker) as previously described [33], except that the injection solution contained 10% v/v EtOH or PQ/MitoPQ from an EtOH stock solution in Ringers buffer [182 mM KCl, 46 mM NaCl, 3 mM CaCl2, 10 mM Tris-base; pH 7.2 HCl] supplemented with 1 mg/mL Brilliant Blue dye. Following recovery, injected flies were returned to vials of food, incubated at 25 °C, and their survival monitored. A total of ~60–80 flies were injected per condition. |
| References |
[1]. Selective superoxide generation within mitochondria by the targeted redox cycler MitoParaquat. Free Radic Biol Med. 2015 Dec;89:883-94. |
| Additional Infomation | Superoxide is the proximal reactive oxygen species (ROS) produced by the mitochondrial respiratory chain and plays a major role in pathological oxidative stress and redox signaling. While there are tools to detect or decrease mitochondrial superoxide, none can rapidly and specifically increase superoxide production within the mitochondrial matrix. This lack impedes progress, making it challenging to assess accurately the roles of mitochondrial superoxide in cells and in vivo. To address this unmet need, we synthesized and characterized a mitochondria-targeted redox cycler, MitoParaquat (MitoPQ) that comprises a triphenylphosphonium lipophilic cation conjugated to the redox cycler paraquat. MitoPQ accumulates selectively in the mitochondrial matrix driven by the membrane potential. Within the matrix, MitoPQ produces superoxide by redox cycling at the flavin site of complex I, selectively increasing superoxide production within mitochondria. MitoPQ increased mitochondrial superoxide in isolated mitochondria and cells in culture ~a thousand-fold more effectively than untargeted paraquat. MitoPQ was also more toxic than paraquat in the isolated perfused heart and in Drosophila in vivo. MitoPQ enables the selective generation of superoxide within mitochondria and is a useful tool to investigate the many roles of mitochondrial superoxide in pathology and redox signaling in cells and in vivo. [1] |
Solubility Data
| Solubility (In Vitro) |
H2O : ~50 mg/mL (~52.38 mM) DMSO : ~33.33 mg/mL (~34.92 mM) |
| Solubility (In Vivo) |
Note: Listed below are some common formulations that may be used to formulate products with low water solubility (e.g. < 1 mg/mL), you may test these formulations using a minute amount of products to avoid loss of samples. Injection Formulations (e.g. IP/IV/IM/SC) Injection Formulation 1: DMSO : Tween 80: Saline = 10 : 5 : 85 (i.e. 100 μL DMSO stock solution → 50 μL Tween 80 → 850 μL Saline) *Preparation of saline: Dissolve 0.9 g of sodium chloride in 100 mL ddH ₂ O to obtain a clear solution. Injection Formulation 2: DMSO : PEG300 :Tween 80 : Saline = 10 : 40 : 5 : 45 (i.e. 100 μL DMSO → 400 μLPEG300 → 50 μL Tween 80 → 450 μL Saline) Injection Formulation 3: DMSO : Corn oil = 10 : 90 (i.e. 100 μL DMSO → 900 μL Corn oil) Example: Take the Injection Formulation 3 (DMSO : Corn oil = 10 : 90) as an example, if 1 mL of 2.5 mg/mL working solution is to be prepared, you can take 100 μL 25 mg/mL DMSO stock solution and add to 900 μL corn oil, mix well to obtain a clear or suspension solution (2.5 mg/mL, ready for use in animals). Injection Formulation 4: DMSO : 20% SBE-β-CD in saline = 10 : 90 [i.e. 100 μL DMSO → 900 μL (20% SBE-β-CD in saline)] *Preparation of 20% SBE-β-CD in Saline (4°C,1 week): Dissolve 2 g SBE-β-CD in 10 mL saline to obtain a clear solution. Injection Formulation 5: 2-Hydroxypropyl-β-cyclodextrin : Saline = 50 : 50 (i.e. 500 μL 2-Hydroxypropyl-β-cyclodextrin → 500 μL Saline) Injection Formulation 6: DMSO : PEG300 : castor oil : Saline = 5 : 10 : 20 : 65 (i.e. 50 μL DMSO → 100 μLPEG300 → 200 μL castor oil → 650 μL Saline) Injection Formulation 7: Ethanol : Cremophor : Saline = 10: 10 : 80 (i.e. 100 μL Ethanol → 100 μL Cremophor → 800 μL Saline) Injection Formulation 8: Dissolve in Cremophor/Ethanol (50 : 50), then diluted by Saline Injection Formulation 9: EtOH : Corn oil = 10 : 90 (i.e. 100 μL EtOH → 900 μL Corn oil) Injection Formulation 10: EtOH : PEG300:Tween 80 : Saline = 10 : 40 : 5 : 45 (i.e. 100 μL EtOH → 400 μLPEG300 → 50 μL Tween 80 → 450 μL Saline) Oral Formulations Oral Formulation 1: Suspend in 0.5% CMC Na (carboxymethylcellulose sodium) Oral Formulation 2: Suspend in 0.5% Carboxymethyl cellulose Example: Take the Oral Formulation 1 (Suspend in 0.5% CMC Na) as an example, if 100 mL of 2.5 mg/mL working solution is to be prepared, you can first prepare 0.5% CMC Na solution by measuring 0.5 g CMC Na and dissolve it in 100 mL ddH2O to obtain a clear solution; then add 250 mg of the product to 100 mL 0.5% CMC Na solution, to make the suspension solution (2.5 mg/mL, ready for use in animals). Oral Formulation 3: Dissolved in PEG400 Oral Formulation 4: Suspend in 0.2% Carboxymethyl cellulose Oral Formulation 5: Dissolve in 0.25% Tween 80 and 0.5% Carboxymethyl cellulose Oral Formulation 6: Mixing with food powders Note: Please be aware that the above formulations are for reference only. InvivoChem strongly recommends customers to read literature methods/protocols carefully before determining which formulation you should use for in vivo studies, as different compounds have different solubility properties and have to be formulated differently. (Please use freshly prepared in vivo formulations for optimal results.) |
| Preparing Stock Solutions | 1 mg | 5 mg | 10 mg | |
| 1 mM | 1.0477 mL | 5.2385 mL | 10.4769 mL | |
| 5 mM | 0.2095 mL | 1.0477 mL | 2.0954 mL | |
| 10 mM | 0.1048 mL | 0.5238 mL | 1.0477 mL |