Physicochemical Properties
| Molecular Formula | C40H67N5O8 |
| Molecular Weight | 746.000 |
| Exact Mass | 745.498 |
| Elemental Analysis | C, 64.40; H, 9.05; N, 9.39; O, 17.16 |
| CAS # | 863971-12-4 |
| Related CAS # | MMAF;745017-94-1;MMAF hydrochloride;1415246-68-2 |
| PubChem CID | 57587881 |
| Appearance | Off-white to light yellow to be determined |
| Density | 1.1±0.1 g/cm3 |
| Boiling Point | 871.8±65.0 °C at 760 mmHg |
| Flash Point | 481.0±34.3 °C |
| Vapour Pressure | 0.0±0.3 mmHg at 25°C |
| Index of Refraction | 1.513 |
| LogP | 4.66 |
| Hydrogen Bond Donor Count | 3 |
| Hydrogen Bond Acceptor Count | 9 |
| Rotatable Bond Count | 22 |
| Heavy Atom Count | 53 |
| Complexity | 1180 |
| Defined Atom Stereocenter Count | 9 |
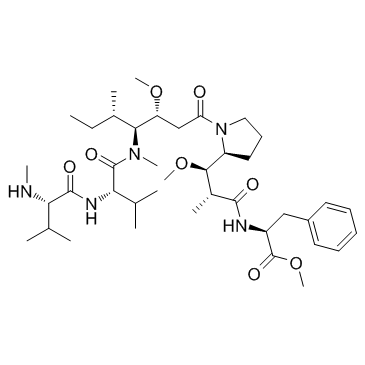
| SMILES | [C@@H]([C@@H]1CCCN1C(=O)C[C@@H](OC)[C@H]([C@@H](C)CC)N(C)C(=O)[C@H](C(C)C)NC(=O)[C@@H](NC)C(C)C)(OC)[C@@H](C)C(=O)N[C@H](C(=O)OC)CC1C=CC=CC=1 |
| InChi Key | WRVLBJXFSHALRZ-FUVGGWJZSA-N |
| InChi Code | InChI=1S/C40H67N5O8/c1-13-26(6)35(44(9)39(49)34(25(4)5)43-38(48)33(41-8)24(2)3)31(51-10)23-32(46)45-21-17-20-30(45)36(52-11)27(7)37(47)42-29(40(50)53-12)22-28-18-15-14-16-19-28/h14-16,18-19,24-27,29-31,33-36,41H,13,17,20-23H2,1-12H3,(H,42,47)(H,43,48)/t26-,27+,29-,30-,31+,33-,34-,35-,36+/m0/s1 |
| Chemical Name | Methyl ((2R,3R)-3-((S)-1-((3R,4S,5S)-4-((S)-N,3-dimethyl-2-((S)-3-methyl-2-(methylamino)butanamido)butanamido)-3-methoxy-5-methylheptanoyl)pyrrolidin-2-yl)-3-methoxy-2-methylpropanoyl)-L-phenylalaninate |
| Synonyms | MMAFOMe; MMAF-OMe; 863971-12-4; methyl (2S)-2-[[(2R,3R)-3-methoxy-3-[(2S)-1-[(3R,4S,5S)-3-methoxy-5-methyl-4-[methyl-[(2S)-3-methyl-2-[[(2S)-3-methyl-2-(methylamino)butanoyl]amino]butanoyl]amino]heptanoyl]pyrrolidin-2-yl]-2-methylpropanoyl]amino]-3-phenylpropanoate; Monomethyl auristatin F methyl ester; SCHEMBL9921233; CHEMBL5180760; Monomethyl auristatin F methyl ester |
| HS Tariff Code | 2934.99.9001 |
| Storage |
Powder-20°C 3 years 4°C 2 years In solvent -80°C 6 months -20°C 1 month Note: This product is not stable in solution, please use freshly prepared working solution for optimal results. |
| Shipping Condition | Room temperature (This product is stable at ambient temperature for a few days during ordinary shipping and time spent in Customs) |
Biological Activity
| Targets | Tubulin; microtubule; Auristatin |
| ln Vitro |
The IC50 values of 2.5F-Fc and 2.5F-Fc-MMAF are comparable (6.9±1.1 vs. 8.3±1.3 nM, respectively), suggesting that integrin-binding affinity is not significantly affected by MMAF conjugation[1].
2.5F–Fc–MMAF binds with low nanomolar affinity to human tumor cells [1] Competition binding assays were performed to compare the relative binding affinities of 2.5F–Fc, 2.5F–Fc–MMAF, and CTRL–Fc–MMAF to U87MG cells. Cells were incubated with varying concentrations of knottin–Fc proteins and a constant amount of AF488-labeled 2.5F peptide competitor at 4°C to prevent internalization. Fluorescent binding signals were measured using flow cytometry and half-maximal inhibitory concentration (IC50) values were determined by nonlinear regression analysis. 2.5F–Fc and 2.5F–Fc–MMAF had similar IC50 values (6.9 ± 1.1 vs. 8.3 ± 1.3 nmol/L, respectively), indicating that MMAF conjugation has negligible impact on integrin-binding affinity (Fig. 3A). CTRL–Fc–MMAF did not compete AF488–2.5F binding to U87MG cells at concentrations up to 200 nmol/L, demonstrating lack of measurable integrin binding from this negative control protein (Supplementary Fig. S2). The relative binding affinity of 2.5F–Fc–MMAF to A2780 and MB-468 cell lines was also measured, with IC50 values of 1.1 ± 1.2 and 1.2 ± 1.2 nmol/L, respectively (Fig. 3B and C).[1] 2.5F–Fc–MMAF inhibits proliferation of human tumor cells [1] Proliferation of U87MG, A2780, and MB-468 cell lines was assayed after treatment with 2.5F–Fc–MMAF and compared with the effects of 2.5F–Fc or linker-modified MMAF added separately or in combination (Fig. 4). In all cell lines tested, 2.5F–Fc treatment alone exhibits moderate inhibition of cell proliferation at the highest concentrations tested (up to 1 μmol/L), as measured by cell dehydrogenase activity, which produces a formazan dye that can be detected by spectrophotometry. The cytotoxicity of 2.5F–Fc at high concentrations, particularly in A2780 cells, and to a lesser degree MB-468 cells, is likely due to the ability of integrin-targeting molecules to disrupt cell adhesion. Similar results were seen when tumor cells were treated with high concentrations of 2.5F peptide in a previous study, in contrast with U87MG cells which are more resistant to detachment-induced apoptosis. Linker-modified MMAF treatment alone inhibits cell proliferation to some degree; a similar level of inhibition was observed upon coadministration of 2.5F–Fc plus linker-modified MMAF, indicating the lack of synergistic effects from combination treatment. Similar trends were observed across all three cell lines tested. The highest level of inhibition of cell proliferation occurred upon treatment with 2.5F–Fc-MMAF, with the greatest effects observed in U87MG cells, potentially due to the high integrin expression levels on these cells compared with A2780 and MB-468 cells. IC50 values for 2.5F–Fc–MMAF treatment were: U87MG = 9.2 ± 1.1 nmol/L, A2780 = 26.1 ± 1.1 nmol/L, and MB-468 = 54.1 ± 1.0 nmol/L. Cells treated with CTRL–Fc–MMAF exhibit less inhibition of proliferation compared with 2.5F–Fc–MMAF or linker-modified MMAF alone (Supplementary Fig. S3). These results demonstrate integrin-targeting specificity of drug delivery mediated by 2.5F–Fc–MMAF and suggest that conjugation of MMAF to CTRL-Fc, which does not bind integrins, reduces nonspecific activity of free drug. |
| ln Vivo |
2.5F–Fc–MMAF functions as an effective antitumor agent in U87MG xenografts [1] Next, 2.5F–Fc–MMAF was tested for its ability to inhibit tumor growth in U87MG xenograft models. U87MG cells were chosen for these studies, as they showed the greatest response to inhibition of cell proliferation upon treatment with 2.5F–Fc–MMAF. In a preliminary study, nu/nu mice (n = 5 per treatment group) were inoculated with U87MG cells in their right flank and tumors were allowed to establish for 6 days, with an average size of 35 mm2 before initiation of therapy. We first evaluated different dosing amounts and schedules of 2.5F–Fc–MMAF administered via intraperitoneal (i.p.) injection: 10 or 5 mg/kg administered twice or three times per week or 1 mg/kg administered three times per week, for a period of 3 weeks. A dose-responsive effect on tumor regression was seen, with the greatest effects observed in the 10 mg/kg treatment groups (Supplementary Fig. S4). The 10 mg/kg dosing groups both exhibited 80% survival at day 50, as compared with 0% in the control mice (P = 0.0189). No significant difference in tumor regression (Supplementary Fig. S4A) or survival benefit (Supplementary Fig. S4B) was seen between two or three times a week dosing at either 5 mg/kg (P > 0.99) or 10 mg/kg (P > 0.99). On the basis of these initial results, we performed a more extensive study, testing the in vivo efficacy of 2.5F–Fc–MMAF compared with its individual components (2.5F–Fc or linker-modified MMAF), and the nonbinding CTRL-Fc-MMAF control, all administered at equal dosing frequency and molar equivalent dosing. As above, nu/nu mice were inoculated with U87MG cells in their flank and allowed to establish for 6 days, this time with an average tumor size of 47.5 mm2 before initiation of therapy. Mice were assigned to one of five groups (n = 8–9): (i) untreated control, (ii) 2.5F–Fc–MMAF, (iii) CTRL–Fc–MMAF, (iv) 2.5F–Fc (all administered at 10 mg/kg), or (v) linker-modified MMAF (0.24 mg/kg; corresponding to a molar equivalent of MMAF). Compounds were administered via intraperitoneal injection twice per week for a total of 3 weeks of dosing. The treatment appeared to be well tolerated, with no significant weight loss or adverse events observed in any of the treatment groups (Supplementary Fig. S5). Significant tumor regression was again seen with 2.5F–Fc–MMAF treatment; however, we hypothesize that the larger average tumor size at the start of dosing (47.5 vs. 35 mm2) may have affected the durability of the response compared with the pilot experiment. Day 15 was chosen for statistical comparison, as it was the final day of the study with all animals included. When comparing tumor size in treated groups compared with the untreated control at day 15 after tumor inoculation, only 2.5F–Fc–MMAF administration yielded a significant regression in growth (P < 0.0001). In contrast, no significant effect on tumor regression or survival benefit was seen in the groups dosed with 2.5F–Fc or MMAF alone, with results similar to the untreated controls (Fig. 5). The effect of CTRL–Fc–MMAF on tumor size at day 15 was not significant (P = 0.7044). A moderate but not statistically significant effect (P = 0.0772) on survival was observed in the group dosed with CTRL–Fc–MMAF compared with untreated controls. It is possible that prolonged serum half-life or Fc-mediated cell trafficking of MMAF could result from its chemical conjugation to the CTRL–Fc fusion protein. Similar moderate effects have been observed with MMAF-conjugated control antibodies in other studies. |
| Enzyme Assay |
Competition cell-binding assays [1] To measure the relative binding affinities of knottin–Fc fusion proteins, competition binding assays were performed as described previously with some modifications. AlexaFluor 488–conjugated EETI 2.5F (AF488-2.5F) was used as a competitor to compare the relative binding of 2.5F–Fc, 2.5F–Fc–MMAF, and CTRL–Fc–MMAF. Briefly, 4 × 10⁴ cells were detached with cell dissociation buffer, washed with IBB (25 mmol/L TRIS, pH 7.4, 150 mmol/L NaCl, 2 mmol/L CaCl2, 1 mmol/L MgCl2, 1 mmol/L MnCl2, and 0.1% BSA) and incubated with 2 nmol/L AF488–2.5F and varying concentrations of knottin–Fc fusions in 1 mL of IBB at 4°C for 2 hours. The cell-bound fluorescence remaining after washing twice with 1 mL of PBS/BSA was determined by flow cytometry, as described above. Adjusted fluorescence values were calculated as the geometric mean of the fluorescence signal for the negative control (cells only) subtracted from the geometric mean of fluorescence signal of the sample. From this, the percentage bound was calculated as the adjusted fluorescence of each sample divided by the adjusted fluorescence of the positive control for each cell line × 100. Half-maximal inhibitory concentration (IC50) values were determined by nonlinear regression analysis using Prism. Error bars represent the SD of experiments performed in triplicate. |
| Cell Assay |
Cell proliferation [1] Cells were seeded in a 96-well plate at a density of 2,000 cells per well and grown overnight at 37°C, 5% CO2 in the media described for each cell line above. Cells were subsequently treated with 100 μL of fresh media, containing varying concentrations of knottin–Fc fusion proteins or linker-modified MMAF, and incubated for 5 days at 37°C, 5% CO2. Cell proliferation was measured using the Cell Counting Kit-8 (CCK-8), by adding the water-soluble tetrazolium salt, WST-8, to each well in an amount equal to 10% of the culture volume. After incubation for 1 hour at 37°C, absorbance at 450 nm was measured with a Synergy H4 microtiter plate reader. Cell proliferation was expressed as a percentage of absorbance relative to the control of untreated cells. We processed the data for these experiments by first subtracting a background value from each well based on absorbance of CCK-8 + media (no cells). Percent maximum proliferation was then reported as (sample − background)/(control − background) × 100. Error bars represent the SD of experiments performed in triplicate. |
| Animal Protocol | Animal experiments Animal procedures were carried out according to a protocol approved by the Stanford University Administrative Panels on Laboratory Animal Care (APLAC #22942). For tumor cell implantation, 6-week-old female nu/nu mice (Charles River Laboratory) were anesthetized with 2.5% isoflurane by inhalation with a flow rate of 1 L/minute. A volume of 100 μL of 50/50 PBS/Matrigel (Corning #356231), containing 5 × 10⁶ U87MG cells, was injected subcutaneously into the flank. Tumors were allowed to grow for 6 days until reaching a size of approximately 30 to 50 mm2 in tumor area. At day 6 after inoculation, all mice were weighed and tumors measured. Mice were binned into experimental groups to ensure equivalent average tumor size and average weight across each group. All compounds tested were administered via intraperitoneal injection in 100 μL PBS, with dosing frequency and concentration dependent on therapeutic group as indicated. Tumors were measured three times weekly using digital calipers, and animal weight was recorded on each dosing day to monitor mice for weight loss as a measure of compound toxicity. Tumor area was calculated using area = x × y, where x is the longest axis of the tumor and y is the axis perpendicular. Euthanasia criteria were defined as 20% body weight loss or tumor size greater than 100 mm2 in area. |
| References |
[1]. Targeted Drug Delivery with an Integrin-Binding Knottin-Fc-MMAF Conjugate Produced by Cell-Free Protein Synthesis. Mol Cancer Ther. 2016 Jun;15(6):1291-300. |
| Additional Infomation | Antibody-drug conjugates (ADC) have generated significant interest as targeted therapeutics for cancer treatment, demonstrating improved clinical efficacy and safety compared with systemic chemotherapy. To extend this concept to other tumor-targeting proteins, we conjugated the tubulin inhibitor monomethyl-auristatin-F (MMAF) to 2.5F-Fc, a fusion protein composed of a human Fc domain and a cystine knot (knottin) miniprotein engineered to bind with high affinity to tumor-associated integrin receptors. The broad expression of integrins (including αvβ3, αvβ5, and α5β1) on tumor cells and their vasculature makes 2.5F-Fc an attractive tumor-targeting protein for drug delivery. We show that 2.5F-Fc can be expressed by cell-free protein synthesis, during which a non-natural amino acid was introduced into the Fc domain and subsequently used for site-specific conjugation of MMAF through a noncleavable linker. The resulting knottin-Fc-drug conjugate (KFDC), termed 2.5F-Fc-MMAF, had approximately 2 drugs attached per KFDC. 2.5F-Fc-MMAF inhibited proliferation in human glioblastoma (U87MG), ovarian (A2780), and breast (MB-468) cancer cells to a greater extent than 2.5F-Fc or MMAF alone or added in combination. As a single agent, 2.5F-Fc-MMAF was effective at inducing regression and prolonged survival in U87MG tumor xenograft models when administered at 10 mg/kg two times per week. In comparison, tumors treated with 2.5F-Fc or MMAF were nonresponsive, and treatment with a nontargeted control, CTRL-Fc-MMAF, showed a modest but not significant therapeutic effect. These studies provide proof-of-concept for further development of KFDCs as alternatives to ADCs for tumor targeting and drug delivery applications.[1] |
Solubility Data
| Solubility (In Vitro) | DMSO : ≥ 100 mg/mL (~134.05 mM) |
| Solubility (In Vivo) |
Solubility in Formulation 1: ≥ 2.5 mg/mL (3.35 mM) (saturation unknown) in 10% DMSO + 40% PEG300 + 5% Tween80 + 45% Saline (add these co-solvents sequentially from left to right, and one by one), clear solution. For example, if 1 mL of working solution is to be prepared, you can add 100 μL of 25.0 mg/mL clear DMSO stock solution to 400 μL PEG300 and mix evenly; then add 50 μL Tween-80 to the above solution and mix evenly; then add 450 μL normal saline to adjust the volume to 1 mL. Preparation of saline: Dissolve 0.9 g of sodium chloride in 100 mL ddH₂ O to obtain a clear solution. Solubility in Formulation 2: ≥ 2.5 mg/mL (3.35 mM) (saturation unknown) in 10% DMSO + 90% (20% SBE-β-CD in Saline) (add these co-solvents sequentially from left to right, and one by one), clear solution. For example, if 1 mL of working solution is to be prepared, you can add 100 μL of 25.0 mg/mL clear DMSO stock solution to 900 μL of 20% SBE-β-CD physiological saline solution and mix evenly. Preparation of 20% SBE-β-CD in Saline (4°C,1 week): Dissolve 2 g SBE-β-CD in 10 mL saline to obtain a clear solution. Solubility in Formulation 3: ≥ 2.5 mg/mL (3.35 mM) (saturation unknown) in 10% DMSO + 90% Corn Oil (add these co-solvents sequentially from left to right, and one by one), clear solution. For example, if 1 mL of working solution is to be prepared, you can add 100 μL of 25.0 mg/mL clear DMSO stock solution to 900 μL of corn oil and mix evenly. Solubility in Formulation 4: 10% DMSO+ 40% PEG300+ 5% Tween-80+ 45% saline: ≥ 2.5 mg/mL (3.35 mM) (Please use freshly prepared in vivo formulations for optimal results.) |
| Preparing Stock Solutions | 1 mg | 5 mg | 10 mg | |
| 1 mM | 1.3405 mL | 6.7024 mL | 13.4048 mL | |
| 5 mM | 0.2681 mL | 1.3405 mL | 2.6810 mL | |
| 10 mM | 0.1340 mL | 0.6702 mL | 1.3405 mL |