Metformin HCl is a hypoglycemic medication used in the treatment of type 2 diabetes (non-insulin-dependent diabetes mellitus). It decreases hyperglycemia in hepatocytes primarily by suppressing glucose production by the liver (hepatic gluconeogenesis). Metformin activates AMPK in hepatocytes, as a result, acetyl-CoA carboxylase (ACC) activity is reduced, fatty acid oxidation is induced, and expression of lipogenic enzymes is suppressed.
Physicochemical Properties
| Molecular Formula | C4H11N5.HCL | |
| Molecular Weight | 165.62 | |
| Exact Mass | 165.078 | |
| Elemental Analysis | C, 29.01; H, 7.30; Cl, 21.40; N, 42.29 | |
| CAS # | 1115-70-4 | |
| Related CAS # | Metformin-d6 hydrochloride;1185166-01-1; 657-24-9; 1115-70-4 (HCl); 121369-64-0 (glycinate); 58840-24-7 (orotate); 34461-22-8 ( embonate); 1384526-74-2 (icosapent) | |
| PubChem CID | 4091 | |
| Appearance | White to off-white solid | |
| Boiling Point | 224.1ºC at 760 mmHg | |
| Melting Point | 223-226 °C(lit.) | |
| Flash Point | 89.3ºC | |
| Vapour Pressure | 0.0929mmHg at 25°C | |
| LogP | 1.058 | |
| Hydrogen Bond Donor Count | 3 | |
| Hydrogen Bond Acceptor Count | 1 | |
| Rotatable Bond Count | 2 | |
| Heavy Atom Count | 9 | |
| Complexity | 132 | |
| Defined Atom Stereocenter Count | 0 | |
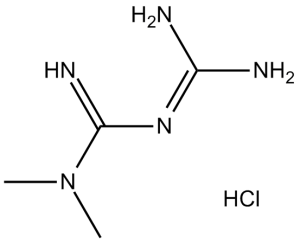
| SMILES | N(/C(=N\[H])/N=C(\N([H])[H])/N([H])[H])(C([H])([H])[H])C([H])([H])[H] |
|
| InChi Key | OETHQSJEHLVLGH-UHFFFAOYSA-N | |
| InChi Code | InChI=1S/C4H11N5.ClH/c1-9(2)4(7)8-3(5)6;/h1-2H3,(H5,5,6,7,8);1H | |
| Chemical Name | 1,1-Dimethylbiguanide hydrochloride | |
| Synonyms |
|
|
| HS Tariff Code | 2934.99.9001 | |
| Storage |
Powder-20°C 3 years 4°C 2 years In solvent -80°C 6 months -20°C 1 month Note: Please store this product in a sealed and protected environment, avoid exposure to moisture. |
|
| Shipping Condition | Room temperature (This product is stable at ambient temperature for a few days during ordinary shipping and time spent in Customs) |
Biological Activity
| Targets | AMPK; Autophagy; Mitophagy |
| ln Vitro |
The proliferation of ESCs is inhibited by metformin hydrochloride (1,1-Dimethylbiguanide hydrochloride) in a concentration-dependent manner. For A-ESCs, the IC50 is 2.45 mM, and for N-ESCs, it is 7.87 mM. Compared to cells in the proliferative phase, metformin has a more noticeable effect on AMPK signaling activity in A-ESCs from the secretory phase[2]. In cultured rat hepatocytes, metformin hydrochloride (0-500 μM) reduces glycogen production in a dose-dependent manner, with an IC50 value of 196.5 μM[3]. With an IC50 of 5 mM, metformin hydrochloride exhibits both cytotoxic and viable effects on PC-3 cells[4]. Metformin inhibits Bcl-2 and Bcl-xl, upregulates BAX activation with facilitation of BIM, BAD, and PUMA, and induces release of cytochrome c from mitochondria into the cytoplasm, directly inducing caspase-9-mediated mitochondrial apoptosis.[4] Metformin activates AMPK in hepatocytes; as a result, acetyl-CoA carboxylase (ACC) activity is reduced, fatty acid oxidation is induced, and expression of lipogenic enzymes is suppressed. Activation of AMPK by metformin or an adenosine analogue suppresses expression of SREBP-1, a key lipogenic transcription factor. In metformin-treated rats, hepatic expression of SREBP-1 (and other lipogenic) mRNAs and protein is reduced; activity of the AMPK target, ACC, is also reduced. Using a novel AMPK inhibitor, we find that AMPK activation is required for metformin's inhibitory effect on glucose production by hepatocytes. In isolated rat skeletal muscles, metformin stimulates glucose uptake coincident with AMPK activation. Activation of AMPK provides a unified explanation for the pleiotropic beneficial effects of this drug; these results also suggest that alternative means of modulating AMPK should be useful for the treatment of metabolic disorders.[1] Metformin, widely recommended in the management of T2DM, exerts its pleiotropic effects via 5'-AMP-activated protein kinase (AMPK); however, its effect on mitophagy remains elusive. Recent evidence demonstrates that peripheral blood mononuclear cells (PBMCs) express insulin receptors and the human organic cation transporter protein, and they are extensively being used as a surrogate for examining mitochondrial function in T2DM. Metformin treatment increased the formation of acidic vesicles and mitophagosomes, upregulated mitophagy markers, and enhanced mitophagic flux, as indicated by increased LC3-II expression and reduced p62 protein levels. In addition, pretreatment with compound C (an AMPK inhibitor) significantly decreased the expression of mitophagy markers in metformin-treated cells, indicating that metformin induces mitophagy via the AMPK pathway. In conclusion, metformin-induced mitophagy may improve cellular function, including in β cells, by restoring normal mitochondrial phenotype, which may prove beneficial in patients with T2DM and other mitochondrial-related diseases. Moreover, PBMCs may be used as a novel diagnostic biomarker for identifying mitochondrial disorders.[2] In this study we revealed for the first time that metformin treatment led to increased apoptosis in human lung cancer cell lines A549 and NCI-H1299 and significantly inhibited the cells proliferation in a dose- and time-dependent manner, which was further demonstrated by the data obtained from A549 tumor xenografts in nude mice. We also found that metformin treatment can activate AMP-activated protein kinase, JNK/p38 MAPK signaling pathway and caspases, as well as upregulate the expression of growth arrest and DNA damage inducible gene 153 (GADD153). Either blockade of JNK/p38 MAPK pathway or knockdown of GADD153 gene abrogated the apoptosis-inducing effect of metformin. Taken together, our data suggest that metformin inhibits the growth of lung cancer cells and induces apoptosis through activating JNK/p38 MAPK pathway and GADD153.[3] This study demonstrates that metformin decreased the number of activated-HSCs through induction of apoptosis, but did not impact numbers of hepatocytes. Metformin upregulated BAX activation with facilitation of BIM, BAD and PUMA; downregulated Bcl-2 and Bcl-xl, but did not affect Mcl-1. Additionally, metformin induced cytochrome c release from mitochondria into the cytoplasm, directly triggering caspase-9-mediated mitochondrial apoptosis. The decline in mitochondrial membrane potential (ΔΨm) and deposition of superoxide in mitochondria accelerated the destruction of the integrity of mitochondrial membrane. Moreover, we verified the therapeutic effect of metformin in our mouse model of liver fibrosis associated with nonalcoholic steatohepatitis (NASH) in which hepatic function, NASH lesions and fibrosis were improved by metformin. In conclusion, this study indicated that metformin has significant therapeutic value in NASH-derived liver fibrosis by inducing apoptosis in HSCs, but does not affect the proliferation of hepatocytes [4]. |
| ln Vivo |
Metformin hydrochloride (1,1-Dimethylbiguanide hydrochloride; 100 mg/kg, po) alone, and metformin (25, 50, 100 mg/kg) with NSC 37745 groups attenuates myocyte necrosis through histological analysis[1].
Metformin exhibits a therapeutic effect in a mouse model of nonalcoholic steatohepatitis (NASH)-related liver fibrosis, resulting in improvements in hepatic function, NASH lesions, and fibrosis.[4] Assessment of Metformin’s in vivo effects.[1] To assess whether selected effects of Metformin described above also occurred in vivo, SD rats were studied (Table 1). Rats were orally dosed with metformin or vehicle (H2O) for 5 days. Rats were starved for 20 hours and then re-fed for 2 hours before the final dose. Four hours after the final dose, tissue and blood samples were obtained for analysis (see Methods). During starvation, there should be very little lipid synthesis. Upon refeeding, hepatic lipid synthesis should be dramatically induced. Metformin’s effects were examined under re-fed conditions. Along with modest decreases in plasma insulin and triglycerides, a small, but significant increase in β-hydroxybutyrate was present, suggesting that hepatic fatty acid oxidation was induced in metformin-treated rats. Furthermore, metformin treatment produced significant decreases in hepatic expression of mRNAs for SREBP-1, FAS, and S14 that were consistent with effects documented in cells (Table 1). The mature SREBP-1 protein in rat liver nuclear extracts was examined using an anti-SREBP1 Ab (Figure 5b). As anticipated, SREBP-1 mature-form protein was not detected in hepatic nuclear extracts from starved animals. In re-fed animals, mature SREBP-1 protein had accumulated consistent with an increase in lipid synthesis under this condition. Treatment with Metformin prevented this accumulation. Additional results obtained using hepatic nuclear extracts from re-fed rats after treatment with AICAR (500 mg/kg/day) also showed that the presence of SREBP-1 mature-form protein was ablated. Measurement of AMPK activation in liver ex vivo is difficult because brief hypoxia is known to produce marked activation of the enzyme. Thus we used liver tissue derived from metformin-treated rats to determine that ACC activity was decreased significantly at several tested citrate concentrations (Figure 6). The greatest ACC activity reduction was at a citrate concentration of 1 mM (from 54.6 ± 11.8 to 35.6 ± 7.7 nmol/mg/min; P < 0.01). These results are consistent with metformin having produced in vivo AMPK activation and ACC inactivation. Metformin relieved the lesions in liver of nonalcoholic steatohepatitis (NASH)-associated fibrosis mice models [4] A NASH-associated fibrosis mice model (Fig. 7a) was established to explore whether Metformin can protect liver under disease state in vivo. The weight and biochemical indicators (ALT and AST) of each mouse were measured every other week and every three weeks, respectively. The results showed no significant increase in the weight of HFMCD-diet group relative to MCS-diet group or AIN93 group (Fig. S2a). Moreover, in HFMCD-diet therapeutic treatment group, metformin decreased the both levels of AST and ALT and liver index, compared with MCS-diet group or AIN93 group (Fig. 7b, Fig. S2b). Collectively, metformin improved the liver function in the NASH-associated fibrosis mice model. Paraffin-embedded liver tissue samples obtained from NASH-fibrosis models were stained by hematoxylin and eosin to visualize the effect of Metformin on hepatic lesions. The color of fresh liver tissues in HFMCD group slanted dark (Fig. S2c). Results showed that the liver in the AIN93 or MCS group exhibited no obvious lesions and were not affected by metformin (Fig. S2d). However, the area of steatosis and the amounts of inflammatory cells both decreased with Metformin administration in HFMCD-preventive and therapeutic group (Fig. 7c), indicating a decrease in the severity of NASH lesions. Moreover, the extent of fibrosis was observed by V-G staining. Results showed that collagen accumulation in HFMCD-therapeutic group was much less than that in the HFMCD-diet saline group (Fig. 7d). Masson staining also observed the same results (Fig. S2e). In addition, immunohistochemical staining showed that, the positive rate of cleaved caspase-3 of HSCs in metformin-therapeutic group was 38.7 ± 5.2%, which was higher than that in saline group (7.69 ± 0.61%), blank control (0.58 ± 0.03%), and metformin-therapeutic group (1.82 ± 0.05%), indicating that metformin induced apoptosis in HSCs (Fig. 7e, Table 3). Therefore, metformin delayed fibrosis in mice models. |
| Enzyme Assay |
This study demonstrates that metformin decreased the number of activated-HSCs through induction of apoptosis, but did not impact numbers of hepatocytes. Metformin upregulated BAX activation with facilitation of BIM, BAD and PUMA; downregulated Bcl-2 and Bcl-xl, but did not affect Mcl-1. Additionally, metformin induced cytochrome c release from mitochondria into the cytoplasm, directly triggering caspase-9-mediated mitochondrial apoptosis. The decline in mitochondrial membrane potential (ΔΨm) and deposition of superoxide in mitochondria accelerated the destruction of the integrity of mitochondrial membrane. Moreover, we verified the therapeutic effect of metformin in our mouse model of liver fibrosis associated with nonalcoholic steatohepatitis (NASH) in which hepatic function, NASH lesions and fibrosis were improved by metformin. In conclusion, this study indicated that metformin has significant therapeutic value in NASH-derived liver fibrosis by inducing apoptosis in HSCs, but does not affect the proliferation of hepatocytes [4].
Immunoprecipitation-AMPK assay.[1] Ten micrograms of 35% ammonium sulfate precipitate (containing AMPK) from AICAR- or Metformin-treated rat hepatocytes was immunoprecipitated using polyclonal Ab’s raised against AMPKα1 (NH2-DFYLATSPPDSFLDDHHLTR-OH) or AMPKα2 (NH2-MDDSAMHIPPGLKPH-OH), followed by AMPK assay. Measurements of muscle AMPK activity and glucose uptake.[1] Isolated rat epitrochlearis muscles were incubated for 3 hours with Metformin (2 mM) or control medium followed by measurement of AMPKα1 or AMPKα2 activities as described. For glucose uptake, insulin (300 nM) was present where indicated for the last 30 minutes of the 3-hour incubation. Then, 3-0-methylglucose uptake was measured using a 10-minute incubation in the absence or presence of metformin and/or insulin as described previously. Caspases enzymatic activity assays [4] Caspase 1, 3, 8 and 9 enzymatic activity were measured with caspase activity assay kit following the instructions of manufacture. 2 × 10⁵ cells were lysed on the ice for 15 min and substrates were added sequentially. The enzymatic activity was measured with a microplate reader (λ = 405 nm). |
| Cell Assay |
ESCs are plated in 96-well plates at a concentration of 1×10³cells/well. After attachment, cells are treated with different doses of metformin/compound C for 0 min, 15 min, 1 h, and 24 h. MTT assays are performed as described previously. In brief, MTT (5 mg/mL) is added to the 96-well plates at a volume of 10 μL/well, and the plates are incubated for 4 h. The MTT reaction is terminated by removal of the culture medium containing MTT, and 100 μL DMSO per well are added and incubated at RT on a shaker for 10 min to ensure that the crystals had dissolved sufficiently. Absorbance values are measured at 595 nm. Cell proliferation (percentage of control) is calculated as follows: absorbance (experimental group)/absorbance (control group). Cell proliferation inhibition (percentage of control) is calculated as follows: 100%−cell proliferation (percentage of control). Each experiment is performed in duplicate and repeated six times to assess result consistency [2].
Rat HSCs T6, human hepatocyte L02, and rat hepatocyte BRL-3A were maintained in DMEM, which is supplemented with 10% (v/v) FBS and 1% (v/v) penicillin/streptomycin sulfate at 37 °C in a humidified 5% CO2 incubator. The human hepatic stellate cells (HSCs) LX-2 are maintained in RPMI 1640 medium. Filtered through millipore membrane filters with a 0.22 m pore size are solutions of metformin and AICAR. The CCK8 assay is used to measure the effects of various metformin and AICAR concentrations on the growth of hepatic stellate cells. Following a 24-hour treatment with varying doses of metformin and AICAR, the expression of collagen and -SMA protein is discovered using a Western blot. After giving cells 10 mM metformin and 0.5 mM AICAR for 24 hours, Western blot is used to identify the expression of collagen and the -SMA protein. RT-qPCR is used to find the mRNA levels of collagen I and -SMA. Measurements of AMPK, ACC, and fatty acid oxidation in primary hepatocytes. [1] Hepatocytes were isolated from male Sprague Dawley (SD) rats by collagenase digestion. For the AMPK assay, cells were seeded in six-well plates at 1.5 × 10⁶ cells/well in DMEM containing 100 U/ml penicillin, 100 μg/ml streptomycin, 10% FBS, 100 nM insulin, 100 nM dexamethasone, and 5 μg/ml transferrin for 4 hours. Cells were then cultured in serum-free DMEM for 16 hours followed by treatment for 1 hour or 7 hours with control medium, 5-amino-imidazole carboxamide riboside (AICAR), or Metformin at concentrations indicated. For a 39-hour treatment, cells for both control and Metformin (10 or 20 μM) groups were cultured in DMEM plus 5% FBS and 100 nM insulin, and the fresh control and Metformin-containing medium were replaced every 12 hours (last medium change was 3 hours before harvest). After treatment, the cells were directly lysed in digitonin-containing and phosphatase inhibitor–containing buffer A, followed by precipitation with ammonium sulfate at 35% saturation. AMPK activity was determined by measurement of phosphorylation of a synthetic peptide substrate, SAMS (HMRSAMSGLHLVKRR). For ACC assay, the 35% ammonium sulfate precipitate from digitonin-lysed hepatocytes (4 μg each) was used for determination of ACC activity via 14CO2 fixation in the presence of 20 mM citrate as done previously. For fatty acid oxidation, the oxidation of 14C-oleate to acid-soluble products was performed as done previously, but in medium M199 in the absence of albumin. |
| Animal Protocol |
The animals are randomized into six groups consisting of six rats each. Rats in group 1 (control) receives a subcutaneous injection of physiological saline (0.5 mL) and are left untreated for the entire experimental period. Rats in group 2 receives an oral administration of metformin (100 mg/kg; twice daily) for 2 days and are subcutaneously injected with saline at an interval of 24 h for 2 consecutive days. Rats in group 3 (MI control) receives an oral administration of saline (twice daily) for 2 days and are sc injected with isoproterenol (100 mg/kg) daily for 2 consecutive days at an interval of 24 h. Rats in groups 4 to 6 are treated with metformin at 25, 50, and 100 mg/kg. Metformin is dissolved in saline and is gavaged at a volume of 0.25-0.5 mL twice a day at an interval of 12 h, started immediately before isoproterenol injection [1].
Oral gavage was used to administer 1 ml of Metformin (100 mg/ml) or water alone to male SD rats (300–350 g, n = 7–8). Rats were treated once (see Table 1and Figure 5b) or twice (see Figure 6) a day for 5 days. Rats were starved for 20 hours and then re-fed for 2 hours before the final dose; 4 hours after final dose, the animals were anesthetized and livers rapidly removed by freeze clamping followed by blood withdrawal. RNA was prepared from the freeze-clamped liver by Ultraspec RNA isolation reagent. Nuclear extracts were prepared from a pool of seven rat livers. Glucose levels were determined using the standard glucose oxidase assay kit; β-hydroxybutyrate concentrations were assayed by measuring the reduction of NAD to NADH with a standard assay kit. FFA levels were measured with the assay kit.Triglyceride levels were assayed with a kit. Insulin concentrations were measured with the enzyme-immunoassay kit.[1] Male C57BL/6N mice (6–8 weeks old, weight, 16–20 g) were randomly divided into three groups (n = 10 per group): (a) high-fat methionine/choline-deficient (HFMCD) diet group (the NASH-fibrosis model group); (b) methionine/choline-sufficient (MCS) diet group (the model control group); (c) AIN93 diet group (the blank control group). Each group were divided into two sub-groups (n = 5 per group): one was intraperitoneally injected with Metformin, the other with saline. Mice were housed in an environment where temperature, humidity and light were controlled (temperature 25 ± 2 °C, a 12/12 h light/dark cycle, 55 ∼ 60 % humidity). All mice got access to the diet and water, which were changed at a fixed time every afternoon. The normal control and model control mice were fed at the same time as the HFMCD group. All mice were divided into preventive group (intraperitoneal injection from the first week), therapeutic group (intraperitoneal injection from the eighth week) and saline group according to the administration time of metformin and saline. The concentration gradient of Metformin mice received ranged from 10 mg kg−1 to 200 mg kg−1 to get a proper concentration. Metformin was dissolved in saline. Mice received metformin or saline (65 mg kg−1 i.p.) administration every other day for 11 weeks or 4 weeks after 8 days’ post-acclimation (the preventative group) or 8 weeks’ HFMCD-diet-induced liver injury (the therapeutic group), respectively. |
| ADME/Pharmacokinetics |
Absorption, Distribution and Excretion **Regular tablet absorption** The absolute bioavailability of a metformin 500 mg tablet administered in the fasting state is about 50%-60%. Single-dose clinical studies using oral doses of metformin 500 to 1500 mg and 850 to 2550 mg show that there is a lack of dose proportionality with an increase in metformin dose, attributed to decreased absorption rather than changes in elimination. At usual clinical doses and dosing schedules of metformin, steady-state plasma concentrations of metformin are achieved within 24-48 hours and are normally measured at <1 μg/mL. **Extended-release tablet absorption** After a single oral dose of metformin extended-release, Cmax is reached with a median value of 7 hours and a range of between 4 and 8 hours. Peak plasma levels are measured to be about 20% lower compared to the same dose of regular metformin, however, the extent of absorption of both forms (as measured by area under the curve - AUC), are similar. **Effect of food** Food reduces the absorption of metformin, as demonstrated by about a 40% lower mean peak plasma concentration (Cmax), a 25% lower area under the plasma concentration versus time curve (AUC), and a 35-minute increase in time to peak plasma concentration (Tmax) after ingestion of an 850 mg tablet of metformin taken with food, compared to the same dose administered during fasting. Though the extent of metformin absorption (measured by the area under the curve - AUC) from the metformin extended-release tablet is increased by about 50% when given with food, no effect of food on Cmax and Tmax of metformin is observed. High and low-fat meals exert similar effects on the pharmacokinetics of extended-release metformin. This drug is substantially excreted by the kidney. Renal clearance of metformin is about 3.5 times higher than creatinine clearance, which shows that renal tubular secretion is the major route of metformin elimination. After oral administration, about 90% of absorbed metformin is eliminated by the kidneys within the first 24 hours post-ingestion. The apparent volume of distribution (V/F) of metformin after one oral dose of metformin 850 mg averaged at 654 ± 358 L. Renal clearance is about 3.5 times greater than creatinine clearance, which indicates that tubular secretion is the major route of metformin elimination. Following oral administration, approximately 90% of the absorbed drug is eliminated via the renal route within the first 24 hours. Metformin is slowly and incompletely absorbed from the GI tract, mainly from the small intestine; absorption is complete within 6 hours. The absolute oral bioavailability of the drug under fasting conditions is reported to be approximately 50-60% with metformin hydrochloride doses of 0.5-1.5 g; binding of the drug to the intestinal wall may explain the difference between the amount of drug absorbed (as determined by the urinary and fecal excretion of unchanged drug) and the amount bioavailable in some studies. In single-dose studies with metformin hydrochloride conventional tablets doses of 0.5-1.5 g or 0.85-2.55 g, plasma metformin concentrations did not increase in proportion to increasing doses, suggesting an active saturable absorption process. Similarly, in single-dose studies with an extended-release tablet preparation (Glumetza) at doses of 0.5-2.5 g, plasma metformin concentrations did not increase in proportion to increasing doses. At steady state after administration of a metformin hydrochloride extended-release tablet preparation (Glucophage XR), the AUC and peak plasma concentrations were not dose proportional within the range of 0.5-2 g. However, limited data from studies in animals and in human intestinal cell cultures suggest that transepithelial transfer of metformin in the intestine may occur through a passive, nonsaturable mechanism, possibly involving a paracellular route. In several studies with another metformin hydrochloride extended-release tablet preparation (Fortamet) using doses of 1-2.5 g, metformin exposure was dose-related. Following oral administration of metformin hydrochloride (0.5-1.5 g) as conventional tablets in healthy individuals or in patients with type 2 diabetes mellitus, plasma concentrations decline in a triphasic manner. Following multiple-dose administration of metformin hydrochloride (500 mg twice daily for 7-14 days) as conventional tablets in a limited number of patients with type 2 diabetes mellitus, peak plasma concentrations remained unchanged, but trough drug concentrations were higher than with single-dose administration, suggesting some drug accumulation in a peripheral tissue compartment. No accumulation of metformin appears to occur following repeated oral doses of the drug as extended-release tablets. The principal plasma elimination half-life of metformin averages approximately 6.2 hours; 90% of the drug is cleared within 24 hours in patients with normal renal function. The decline in plasma metformin concentrations is slower after oral than after IV administration of the drug, indicating that elimination is absorption rate-limited. Urinary excretion data and data from whole blood indicate a slower terminal-elimination phase half-life of 8-20 hours (e.g., 17.6 hours)1 suggesting that the erythrocyte mass may be a compartment of distribution. Metformin is distributed rapidly in animals and humans into peripheral body tissues and fluids, particularly the GI tract; the drug also appears to distribute slowly into erythrocytes and into a deep tissue compartment (probably GI tissues). The highest tissue concentrations of metformin (at least 10 times the plasma concentration) occur in the GI tract (e.g., esophagus, stomach, duodenum, jejunum, ileum), with lower concentrations (twice the plasma concentration) occurring in kidney, liver, and salivary gland tissue. The drug distributes into salivary glands with a half-life of about 9 hours. Metformin concentrations in saliva are tenfold lower than those in plasma and may be responsible for the metallic taste reported in some patients receiving the drug. Any local effect of metformin on glucose absorption in the GI tract may be associated with the relatively high GI concentrations of the drug compared with those in other tissues. It is not known whether metformin crosses the blood-brain barrier or the placenta in humans or if the drug is distributed into human milk; however, in lactating rats, metformin is distributed into breast milk at levels comparable to those in plasma. Renal clearance is approximately 3.5 times greater than creatinine clearance, indicating that tubular secretion is the principal route of metformin elimination. Following a single 850-mg oral dose of metformin hydrochloride, renal clearance averaged 552, 491, or 412 mL/minute in nondiabetic adults, diabetic adults, or healthy geriatric individuals, respectively. Renal impairment results in increased peak plasma concentrations of metformin, a prolonged time to peak plasma concentration, and a decreased volume of distribution. Renal clearance is decreased in patients with renal impairment (as measured by decreases in creatinine clearance) and, apparently because of reduced renal function with age, in geriatric individuals. In geriatric individuals, decreased renal and plasma clearance of metformin also results in increased plasma concentrations of the drug; volume of distribution remains unaffected. For more Absorption, Distribution and Excretion (Complete) data for METFORMIN (12 total), please visit the HSDB record page. Metabolism / Metabolites Intravenous studies using a single dose of metformin in normal subjects show that metformin is excreted as unchanged drug in the urine and does not undergo hepatic metabolism (no metabolites have been identified in humans) or biliary excretion. Metformin is not metabolized in the liver or GI tract and is not excreted in bile; no metabolites of the drug have been identified in humans. Metformin is not metabolized. Route of Elimination: Intravenous single-dose studies in normal subjects demonstrate that metformin is excreted unchanged in the urine and does not undergo hepatic metabolism (no metabolites have been identified in humans) nor biliary excretion. Approximately 90% of the drug is eliminated in 24 hours in those with healthy renal function. Renal clearance of metformin is approximately 3.5 times that of creatinine clearance, indicating the tubular secretion is the primary mode of metformin elimination. Half Life: 6.2 hours. Duration of action is 8-12 hours. Biological Half-Life The plasma elimination half-life of metformin is 6.2 hours in the plasma. The elimination half-life in the blood is approximately 17.6 hours, suggesting that the erythrocyte mass may be a compartment of distribution. The principal plasma elimination half-life of metformin averages approximately 6.2 hours ... . The drug distributes into salivary glands with a half-life of about 9 hours. |
| Toxicity/Toxicokinetics |
Toxicity Summary IDENTIFICATION AND USE: Metformin is antihyperglycemic, not hypoglycemic agent. It does not cause insulin release from the pancreas and does not cause hypoglycemia, even in large doses. HUMAN EXPOSURE AND TOXICITY: Metformin is believed to work by inhibiting hepatic glucose production and increasing the sensitivity of peripheral tissue to insulin. It does not stimulate insulin secretion, which explains the absence of hypoglycemia. Metformin also has beneficial effects on the plasma lipid concentrations and promotes weight loss. Accumulation of metformin may occur in patients with renal impairment, and such accumulation rarely can result in lactic acidosis, a serious, potentially fatal metabolic disease. Lactic acidosis constitutes a medical emergency requiring immediate hospitalization and treatment; lactic acidosis is characterized by elevated blood lactate concentrations, decreased blood pH, electrolyte disturbances with an increased anion gap, and an increased lactate/pyruvate ratio. Lactic acidosis also may occur in association with a variety of pathophysiologic conditions, including diabetes mellitus, and whenever substantial tissue hypoperfusion and hypoxemia exist. Approximately 50% of cases of metformin-associated lactic acidosis have been reported to be fatal. No evidence of mutagenicity or chromosomal damage was observed in in vitro test systems, including human lymphocytes assay. ANIMAL STUDIES: No evidence of carcinogenic potential was seen in a 104-week study in male and female rats receiving metformin hydrochloride dosages up to and including 900 mg/kg daily or in a 91-week study in male and female mice receiving metformin hydrochloride at dosages up to and including 1500 mg/kg daily. Cancer preventive effect of metformin (MF) has been studied in mice, rats and hamsters. In the majority of cases metformin treatment leads to inhibition of carcinogenesis. No evidence of impaired fertility was observed in rats following administration of metformin hydrochloride dosages of 600 mg/kg daily. Reproduction studies in rats and rabbits given metformin hydrochloride dosages of 600 mg/kg daily have not revealed teratogenicity. No evidence of mutagenicity or chromosomal damage was observed in vivo in a micronucleus test in mice or in in vitro test systems, including microbial (Ames test) and mammalian (mouse lymphoma) assays. Pretreatment of rat cerebellar granule neurons with metformin greatly enhanced cell viability against glutamate-induced neurotoxicity. In aged male mice fed high-fat diet supplemented with metformin for 6 months, metformin decreased body fat composition and attenuated declines in motor function induced by a high fat diet. Performance in the Morris water maze test of hippocampal based memory function, showed that metformin prevented impairment of spatial reference memory associated with the high fat diet. ECOTOXICITY STUDIES: Adult fathead minnows (Pimephales promelas) were chronically exposed to metformin for 4 wk, at 40 ug/L. Metformin treatment induced significant up-regulation of messenger ribonucleic acid (mRNA) encoding the egg-protein vitellogenin in male fish, an indication of endocrine disruption. Metformin's mechanisms of action differ from other classes of oral antihyperglycemic agents. Metformin decreases blood glucose levels by decreasing hepatic glucose production, decreasing intestinal absorption of glucose, and improving insulin sensitivity by increasing peripheral glucose uptake and utilization. These effects are mediated by the initial activation by metformin of AMP-activated protein kinase (AMPK), a liver enzyme that plays an important role in insulin signaling, whole body energy balance, and the metabolism of glucose and fats. Activation of AMPK is required for metformin's inhibitory effect on the production of glucose by liver cells. Increased peripheral utilization of glucose may be due to improved insulin binding to insulin receptors. Metformin administration also increases AMPK activity in skeletal muscle. AMPK is known to cause GLUT4 deployment to the plasma membrane, resulting in insulin-independent glucose uptake. The rare side effect, lactic acidosis, is thought to be caused by decreased liver uptake of serum lactate, one of the substrates of gluconeogenesis. In those with healthy renal function, the slight excess is simply cleared. However, those with severe renal impairment may accumulate clinically significant serum lactic acid levels. Other conditions that may precipitate lactic acidosis include severe hepatic disease and acute/decompensated heart failure. Toxicity Data Acute oral toxicity (LD50): 350 mg/kg [Rabbit]. Interactions The clinical use of doxorubicin, which is a strong antineoplastic agent, is limited due to its cardiotoxic side effects. Metformin is a drug with antihyperglycemic effects, and it has been shown to have a cardioprotective effect on left ventricular function in experimental animal models of myocardial ischemia. The present study investigated the cardioprotective effect of metformin in rats with doxorubicin cardiotoxicity. Wistar albino rats were used in the study. Forty male, 10-week-old Wistar albino rats were randomly divided four groups. The control group rats were intraperitoneally administered saline solution twice a week, four doses in total. The doxorubicin group rats received doxorubicin (4 mg/kg, twice a week, cumulative dose: 16 mg/kg) intraperitoneally. The metformin group rats received metformin (250 mg/kg/day, every day for 14 days) via gavage. The doxorubicin + metformin group rats received doxorubicin and metformin at the same dose. Left ventricular functions were evaluated by using M-mode echocardiography one day after the last dose of doxorubicin. Heart tissue samples were histopathologically examined. Cardiomyocyte apoptosis was detected using in situ terminal deoxynucleotide transferase assay (TUNEL). Serum brain natriuretic peptide and C-type natriuretic peptide levels were measured. Catalase, superoxide dismutase, glutathione peroxidase, and tumor necrosis factor alpha levels were analyzed in the heart tissue. The assumptions of equality of variances and normal distribution were checked for all variables (Shapiro-Wilk test and Q-Q graphics). To identify intergroup differences, one-way variant analysis or the Kruskal-Wallis test was used. A p<0.05 value was accepted as statistically significant. Our results showed that doxorubicin treatment caused significant deterioration in left ventricular functions by echocardiography, histological heart tissue damage, and increase in cardiomyocyte apoptosis. Doxorubicin + metformin group showed protection in left ventricular function, elimination of histopathologic change, and reduced of cardiomyocyte apoptosis. The present study provided evidence that metformin has cardioprotective effects against doxorubicin cardiotoxicity. The link between inflammation and cancer has been confirmed by the use of anti-inflammatory therapies in cancer prevention and treatment. 5-aminosalicylic acid (5-ASA) was shown to decrease the growth and survival of colorectal cancer (CRC) cells. Studies also revealed that metformin induced apoptosis in several cancer cell lines. We investigated the combinatory effect of 5-ASA and metformin on HCT-116 and Caco-2 CRC cell lines. Apoptotic markers were determined using western blotting. Expression of pro-inflammatory cytokines was determined by RT-PCR. Inflammatory transcription factors and metastatic markers were measured by ELISA. Metformin enhanced CRC cell death induced by 5-ASA through significant increase in oxidative stress and activation of apoptotic machinery. Moreover, metformin enhanced the anti-inflammatory effect of 5-ASA by decreasing the gene expression of IL-1beta, IL-6, COX-2 and TNF-alpha and its receptors; TNF-R1 and TNF-R2. Significant inhibition of activation of NF-kappaB and STAT3 transcription factors, and their downstream targets was also observed. Metformin also enhanced the inhibitory effect of 5-ASA on MMP-2 and MMP-9 enzyme activity, indicating a decrease in metastasis. The current data demonstrate that metformin potentiates the antitumor effect of 5-ASA on CRC cells suggesting their potential use as an adjuvant treatment in CRC. Previous studies suggest that metformin may exert a protective effect on cisplatin-induced cytotoxicity in cancer cells, and this finding has led to a caution for considering metformin use in the treatment of cancer patients. However, in this paper we provide the first demonstration that metformin synergistically augments cisplatin cytotoxicity in the esophageal squamous cancer cell line, ECA109, under glucose-deprivation conditions, which may be more representative of the microenvironment within solid tumors; this effect is very different from the previously reported cytoprotective effect of metformin against cisplatin in commonly used high glucose incubation medium. The potential mechanisms underlying the synergistic effect of metformin on cisplatin-induced cytotoxicity under glucose-deprivation conditions may include enhancement of metformin-associated cytotoxicity, marked reduction in the cellular ATP levels, deregulation of the AKT and AMPK signaling pathways, and impaired DNA repair function. Concomitant treatment with the glucose-lowering drug metformin and the platelet aggregation inhibitor dipyridamole often occurs in patients with type 2 diabetes mellitus who have suffered a cerebrovascular event. The gastrointestinal uptake of metformin is mediated by the human equilibrative nucleoside transporter 4 (ENT4), which is inhibited by dipyridamole in preclinical studies. We hypothesized that dipyridamole lowers the plasma exposure to metformin. Eighteen healthy volunteers (mean age 23 years; 9 male) were randomized in an open-label crossover study. Subjects were allocated to treatment with metformin 500 mg twice daily in combination with dipyridamole slow-release 200 mg twice daily or to metformin alone for 4 days. After a washout period of 10 days, the volunteers were crossed over to the alternative treatment arm. Blood samples were collected during a 10-hr period after intake of the last metformin dose. The primary endpoint was the area under the plasma concentration-time curve (AUC0-12hr) and the maximum plasma metformin concentration (C max). In healthy subjects, dipyridamole did not significantly affect Cmax nor AUC0-12hr of metformin under steady-state conditions. Previous in vitro studies report that dipyridamole inhibits the ENT4 transporter that mediates gastrointestinal uptake of metformin. In contrast, co-administration of dipyridamole at therapeutic dosages to healthy volunteers does not have a clinically relevant effect on metformin plasma steady-state exposure. For more Interactions (Complete) data for METFORMIN (23 total), please visit the HSDB record page. Non-Human Toxicity Values LD50 Mouse iv 180 mg/kg /Metformin hydrochloride/ LD50 Mouse subcutaneous 620 mg/kg /Metformin hydrochloride/ LD50 Rat subcutaneous 300 mg/kg /Metformin hydrochloride/ LD50 Rat oral 1 g/kg /Metformin hydrochloride/ For more Non-Human Toxicity Values (Complete) data for METFORMIN (10 total), please visit the HSDB record page. |
| References |
[1]. Acute treatment with metformin improves cardiac function following NSC 37745 induced myocardial infarction in rats. Pharmacol Rep. 2012;64(6):1476-84. [2]. Metformin promotes mitophagy in mononuclear cells: a potential in vitro model for unraveling metformin's mechanism of action. Ann N Y Acad Sci. 2020 Mar;1463(1):23-36. [3]. Metformin induces apoptosis of lung cancer cells through activating JNK/p38 MAPK pathway and GADD153. Neoplasma. 2011;58(6):482-90. [4]. Mitigation of liver fibrosis via hepatic stellate cells mitochondrial apoptosis induced by metformin. Int Immunopharmacol. 2022 Jul:108:108683. [5]. Metformin inhibits growth of eutopic stromal cells from adenomyotic endometrium via AMPK activation and subsequent inhibition of AKT phosphorylation: a possible role in the treatment of adenomyosis. Reproduction. 2013 Aug 21;146(4):397-406. [6]. Metformin inhibits glycogen synthesis and gluconeogenesis in cultured rat hepatocytes. Diabetes Obes Metab. 2003 May;5(3):189-94. [7]. Therapeutic potential of an anti-diabetic drug, metformin: alteration of miRNA expression in prostate cancer cells. Asian Pac J Cancer Prev. 2013;14(2):765-8. |
| Additional Infomation |
Therapeutic Uses Hypoglycemic Agents Metformin hydrochloride tablets, USP are indicated as an adjunct to diet and exercise to improve glycemic control in adults and children with type 2 diabetes mellitus. /Included in US product label/ Metformin has been used in the management of metabolic and reproductive abnormalities associated with polycystic ovary syndrome. However, adequate and well-controlled clinical trials evaluating metformin therapy for polycystic ovary syndrome remain limited, particularly regarding long-term efficacy, and available data are conflicting regarding the benefits of the drug in ameliorating various manifestations of the condition. /NOT included in US product label/ Metformin is commercially available in fixed combination with glyburide or glipizide for use as an adjunct to diet and exercise to improve glycemic control in adults with diabetes mellitus; such fixed-combination preparations may be used as initial therapy in patients whose hyperglycemia cannot be controlled by diet and exercise alone, or as second-line therapy in patients who do not achieve adequate control of hyperglycemia with metformin or sulfonylurea monotherapy. A thiazolidinedione may be added to metformin in fixed combination with glyburide in patients who have inadequate glycemic control with fixed-combination therapy. For more Therapeutic Uses (Complete) data for METFORMIN (18 total), please visit the HSDB record page. Drug Warnings /BOXED WARNING/ Lactic Acidosis: Lactic acidosis is a rare, but serious, metabolic complication that can occur due to metformin accumulation during treatment with metformin; when it occurs, it is fatal in approximately 50% of cases. Lactic acidosis may also occur in association with a number of pathophysiologic conditions, including diabetes mellitus, and whenever there is significant tissue hypoperfusion and hypoxemia. Lactic acidosis is characterized by elevated blood lactate levels (>5 mmol/L), decreased blood pH, electrolyte disturbances with an increased anion gap, and an increased lactate/pyruvate ratio. When metformin is implicated as the cause of lactic acidosis, metformin plasma levels > 5 ug/mL are generally found. The reported incidence of lactic acidosis in patients receiving metformin hydrochloride tablets, USP is very low (approximately 0.03 cases/1000 patient-years, with approximately 0.015 fatal cases/1000 patient-years). In more than 20,000 patient-years exposure to metformin in clinical trials, there were no reports of lactic acidosis. Reported cases have occurred primarily in diabetic patients with significant renal insufficiency, including both intrinsic renal disease and renal hypoperfusion, often in the setting of multiple concomitant medical/surgical problems and multiple concomitant medications. Patients with congestive heart failure requiring pharmacologic management, in particular those with unstable or acute congestive heart failure who are at risk of hypoperfusion and hypoxemia are at increased risk of lactic acidosis. The risk of lactic acidosis increases with the degree of renal dysfunction and the patient's age. The risk of lactic acidosis may, therefore, be significantly decreased by regular monitoring of renal function in patients taking metformin and by use of the minimum effective dose of metformin. In particular, treatment of the elderly should be accompanied by careful monitoring of renal function. Metformin hydrochloride tablets, USP treatment should not be initiated in patients = 80 years of age unless measurement of creatinine clearance demonstrates that renal function is not reduced, as these patients are more susceptible to developing lactic acidosis. In addition, metformin should be promptly withheld in the presence of any condition associated with hypoxemia, dehydration or sepsis. Because impaired hepatic function may significantly limit the ability to clear lactate, metformin should generally be avoided in patients with clinical or laboratory evidence of hepatic disease. Patients should be cautioned against excessive alcohol intake, either acute or chronic, when taking metformin hydrochloride tablets, USP since alcohol potentiates the effects of metformin hydrochloride tablets, USP on lactate metabolism. In addition, metformin should be temporarily discontinued prior to any intravascular radiocontrast study and for any surgical procedure. The onset of lactic acidosis often is subtle, and accompanied only by nonspecific symptoms such as malaise, myalgias, respiratory distress, increasing somnolence and nonspecific abdominal distress. There may be associated hypothermia, hypotension and resistant bradyarrhythmias with more marked acidosis. The patient and the patient's physician must be aware of the possible importance of such symptoms and the patient should be instructed to notify the physician immediately if they occur. Metformin hydrochloride tablets, USP should be withdrawn until the situation is clarified. Serum electrolytes, ketones, blood glucose and, if indicated, blood pH, lactate levels and even blood metformin levels may be useful. Once a patient is stabilized on any dose level of metformin, gastrointestinal symptoms, which are common during initiation of therapy, are unlikely to be drug related. Later occurrence of gastrointestinal symptoms, could be due to lactic acidosis or other serious disease. Levels of fasting venous plasma lactate above the upper limit of normal but less than 5 mmol/L in patients taking metformin do not necessarily indicate impending lactic acidosis and may be explainable by other mechanisms, such as poorly controlled diabetes or obesity, vigorous physical activity or technical problems in sample handling. Lactic acidosis should be suspected in any diabetic patient with metabolic acidosis lacking evidence of ketoacidosis (ketonuria and ketonemia). Lactic acidosis is a medical emergency that must be treated in a hospital setting. In a patient with lactic acidosis who is taking metformin, the drug should be discontinued immediately and general supportive measures promptly instituted. Because metformin hydrochloride tablets, USP are dialyzable (with a clearance of up to 170 mL/min under good hemodynamic conditions), prompt hemodialysis is recommended to correct the acidosis and remove the accumulated metformin. Such management often results in prompt reversal of symptoms and recovery. Accumulation of metformin may occur in patients with renal impairment, and such accumulation rarely can result in lactic acidosis, a serious, potentially fatal metabolic disease. The risk of developing lactic acidosis is much lower (e.g., 10-fold lower) with metformin than with phenformin (no longer commercially available in the US). However, lactic acidosis constitutes a medical emergency requiring immediate hospitalization and treatment; in such cases, metformin should be discontinued and general supportive therapy (e.g., volume expansion, diuresis) should be initiated immediately. Prompt hemodialysis also is recommended. Lactic acidosis is characterized by elevated blood lactate concentrations (exceeding 45 mg/dL), decreased blood pH (less than 7.35), electrolyte disturbances with an increased anion gap, and an increased lactate/pyruvate ratio. Lactic acidosis also may occur in association with a variety of pathophysiologic conditions, including diabetes mellitus, and whenever substantial tissue hypoperfusion and hypoxemia exist. Approximately 50% of cases of metformin-associated lactic acidosis have been reported to be fatal. However, it has been suggested that in such cases of lactic acidosis not accompanied by conditions predisposing to tissue anoxia (e.g., heart failure, renal or pulmonary disease), techniques for the elimination of metformin from the body may allow recovery rates exceeding 80%. Urinary tract infection has been reported in 8 or 1.1% of patients receiving metformin alone or in fixed combination with glipizide, respectively. Hypertension has been reported in 5.6 or 2.9-3.5% of patients receiving metformin alone or in fixed combination with glipizide, respectively. Musculoskeletal pain has been reported in 6.7 or 8% of patients receiving metformin alone or in fixed combination with glipizide, respectively. Severe acute hepatitis associated with marked elevations in serum hepatic aminotransferase values and cholestasis has been reported following initiation of metformin therapy in a patient receiving glipizide and enalapril. Accidental injury was reported in 7.3 or 5.6% of patients receiving metformin as an extended-release tablet preparation (Fortamet) or as conventional tablets, respectively. Pneumonitis with vasculitis has been reported rarely with concomitant metformin and oral sulfonylurea (e.g., glyburide) therapy. Upper respiratory tract infection was reported in 16.3 or 17.3% of patients receiving metformin or metformin in fixed combination with glyburide, respectively. Upper respiratory tract infection was reported in 8.5 or 8.1-9.9% of patients receiving metformin or metformin in fixed combination with glipizide, respectively, as initial therapy for type 2 diabetes mellitus. Upper respiratory tract infection was reported in 10.7 or 10.3% of patients receiving metformin or metformin in fixed combination with glipizide, respectively, as second-line therapy for type 2 diabetes mellitus. Upper respiratory tract infection was reported in 5.2 or 6.2% of patients receiving metformin or metformin combined with sitagliptin, respectively, in clinical trials. Rhinitis was reported in 4.2 or 5.6% of patients receiving metformin as an extended-release tablet preparation (Fortamet) or as conventional tablets, respectively. Infection was reported in 20.5 or 20.9% of patients receiving an extended-release tablet preparation (Fortamet) or conventional tablets, respectively. For more Drug Warnings (Complete) data for METFORMIN (23 total), please visit the HSDB record page. Pharmacodynamics **General effects** Insulin is an important hormone that regulates blood glucose levels. Type II diabetes is characterized by a decrease in sensitivity to insulin, resulting in elevations in blood glucose when the pancreas can no longer compensate. In patients diagnosed with type 2 diabetes, insulin is unable to exert adequate effects on tissues and cells (i.e. insulin resistance) and insulin deficiency may also be present. Metformin reduces hepatic production of glucose, decreases the intestinal absorption of glucose, and enhances insulin sensitivity by increasing both peripheral glucose uptake and utilization. In contrast with drugs of the sulfonylurea class, which lead to hyperinsulinemia, the secretion of insulin is unchanged with metformin use. **Effect on fasting plasma glucose (FPG) and Glycosylated hemoglobin (HbA1c)** HbA1c is an important periodic measure of glycemic control used to monitor diabetic patients. Fasting plasma glucose is also a useful and important measure of glycemic control. In a 29-week clinical trial of subjects diagnosed with type II diabetes, metformin decreased the fasting plasma glucose levels by an average of 59 mg/dL from baseline, compared to an average increase of 6.3 mg/dL from baseline in subjects taking a placebo. Glycosylated hemoglobin (HbA1c) was decreased by about 1.4% in subjects receiving metformin, and increased by 0.4% in subjects receiving placebo only. Adenomyosis is a finding that is associated with dysmenorrhea and heavy menstrual bleeding, associated with PI3K/AKT signaling overactivity. To investigate the effect of metformin on the growth of eutopic endometrial stromal cells (ESCs) from patients with adenomyosis and to explore the involvement of AMP-activated protein kinase (AMPK) and PI3K/AKT pathways. Primary cultures of human ESCs were derived from normal endometrium (normal endometrial stromal cells (N-ESCs)) and adenomyotic eutopic endometrium (adenomyotic endometrial stroma cells (A-ESCs)). Expression of AMPK was determined using immunocytochemistry and western blot analysis. 3-(4, 5-Dimethylthiazol-2-yl)-2, 5-diphenyltetrazolium bromide assays were used to determine the effects of metformin and compound C on ESCs and also to detect growth and proliferation of ESCs. AMPK and PI3K/AKT signaling was determined by western blotting. A-ECSs exhibited greater AMPK expression than N-ESCs. Metformin inhibited proliferation of ESCs in a concentration-dependent manner. The IC50 was 2.45 mmol/l for A-ESCs and 7.87 mmol/l for N-ESCs. Metformin increased AMPK activation levels (p-AMPK/AMPK) by 2.0±0.3-fold in A-ESCs, 2.3-fold in A-ESCs from the secretory phase, and 1.6-fold in the proliferation phase. The average reduction ratio of 17β-estradiol on A-ESCs was 2.1±0.8-fold in proliferative phase and 2.5±0.5-fold in secretory phase relative to the equivalent groups not treated with 17β-estradiol. The inhibitory effects of metformin on AKT activation (p-AKT/AKT) were more pronounced in A-ESCs from the secretory phase (3.2-fold inhibition vs control) than in those from the proliferation phase (2.3-fold inhibition vs control). Compound C, a selective AMPK inhibitor, abolished the effects of metformin on cell growth and PI3K/AKT signaling. Metformin inhibits cell growth via AMPK activation and subsequent inhibition of PI3K/AKT signaling in A-ESCs, particularly during the secretory phase, suggesting a greater effect of metformin on A-ESCs from secretory phase.[5] Aim: Glycogen synthesis, and glucose and lactate production were examined in cultured rat hepatocytes preincubated with metformin (0-500 micro m) for 24 h. Methods: Cells incubated with[1-13C]-glucose and [1-13C]-lactate allowed us to study the effect of metformin on glucose production from glycogenolysis and gluconeogenesis in a detailed manner using NMR spectroscopy. 1H and 13C-filtered 1H-NMR spectra were recorded by using flow-injection technique. Results: Metformin decreased glycogen synthesis in a dose-dependent manner with an IC50 value of 196.5 micro m. This effect could not be reversed by the presence of the glycogen phosphorylase inhibitor DAB, suggesting that glycogenolysis was not affected. A clear correlation between glucose production and glycogen content (0.97 < R < 0.99; p < 0.001) and lactate production and glycogen content (0.97 < R < 0.99; p < 0.001) was observed. Moreover, a strong inhibition (62%, p < 0.001) of glucose produced from lactate/pyruvate (3 mm/0.3 mm) was observed in cells treated with 350 micro m metformin. Conclusion: Hepatocytes preincubated for 24 h in the presence of metformin at clinically relevant concentrations showed impaired glycogenesis as well as gluconeogenesis.[6] Background and aims: Prostate cancer is the most commonly diagnosed cancer in males in many populations. Metformin is the most widely used anti-diabetic drug in the world, and there is increasing evidence of a potential efficacy of this agent as an anti-cancer drug. Metformin inhibits the proliferation of a range of cancer cells including prostate, colon, breast, ovarian, and glioma lines. MicroRNAs (miRNAs) are a class of small, non- coding, single-stranded RNAs that downregulate gene expression. We aimed to evaluate the effects of metformin treatment on changes in miRNA expression in PC-3 cells, and possible associations with biological behaviour. Materials and methods: Average cell viability and cytotoxic effects of metformin were investigated at 24 hour intervals for three days using the xCELLigence system. The IC50 dose of metformin in the PC-3 cells was found to be 5 mM. RNA samples were used for analysis using custom multi-species microarrays containing 1209 probes covering 1221 human mature microRNAs present in miRBase 16.0 database. Results: Among the human miRNAs investigated by the arrays, 10 miRNAs were up-regulated and 12 miRNAs were down-regulated in the metformin-treated group as compared to the control group. In conclusion, expression changes in miRNAs of miR-146a, miR-100, miR-425, miR-193a-3p and, miR-106b in metformin-treated cells may be important. This study may emphasize a new role of metformin on the regulation of miRNAs in prostate cancer.[7] |
Solubility Data
| Solubility (In Vitro) |
|
|||
| Solubility (In Vivo) |
Solubility in Formulation 1: ≥ 3 mg/mL (18.11 mM) (saturation unknown) in 5% DMSO + 40% PEG300 + 5% Tween80 + 50% Saline (add these co-solvents sequentially from left to right, and one by one), clear solution. Preparation of saline: Dissolve 0.9 g of sodium chloride in 100 mL ddH₂ O to obtain a clear solution. Solubility in Formulation 2: ≥ 3 mg/mL (18.11 mM) (saturation unknown) in 5% DMSO + 95% (20% SBE-β-CD in Saline) (add these co-solvents sequentially from left to right, and one by one), clear solution. Preparation of 20% SBE-β-CD in Saline (4°C,1 week): Dissolve 2 g SBE-β-CD in 10 mL saline to obtain a clear solution. Solubility in Formulation 3: 100 mg/mL (603.79 mM) in PBS (add these co-solvents sequentially from left to right, and one by one), clear solution; with ultrasonication. (Please use freshly prepared in vivo formulations for optimal results.) |
| Preparing Stock Solutions | 1 mg | 5 mg | 10 mg | |
| 1 mM | 6.0379 mL | 30.1896 mL | 60.3792 mL | |
| 5 mM | 1.2076 mL | 6.0379 mL | 12.0758 mL | |
| 10 mM | 0.6038 mL | 3.0190 mL | 6.0379 mL |