EF1502 is a novel, potent and selective GAT1/BGT1 inhibitor that exhibit mechanistic differences in their ability to modulate the ataxia and anticonvulsant action of the extrasynaptic GABA(A) receptor agonist gaboxadol.
Physicochemical Properties
| Molecular Formula | C22H26N2O2S2 |
| Molecular Weight | 414.58404302597 |
| Exact Mass | 414.14 |
| Elemental Analysis | C, 63.74; H, 6.32; N, 6.76; O, 7.72; S, 15.47 |
| CAS # | 684645-54-3 |
| Related CAS # | 684645-54-3;182316-85-4 (HCl);847354-37-4 (R-isomer);847233-24-3 (R-isomer HCl); 847354-38-5 (S-isomer); 847233-25-4 (S-isomer HCl); |
| PubChem CID | 11200819 |
| Appearance | Typically exists as solid at room temperature |
| Hydrogen Bond Donor Count | 1 |
| Hydrogen Bond Acceptor Count | 5 |
| Rotatable Bond Count | 6 |
| Heavy Atom Count | 28 |
| Complexity | 641 |
| Defined Atom Stereocenter Count | 0 |
| SMILES | S1C=CC(C)=C1/C(/C1=C(C)C=CS1)=C\CCN(C)C1C2C(NOC=2CCC1)=O |
| InChi Key | CUESOMOCKVRNIW-UHFFFAOYSA-N |
| InChi Code | InChI=1S/C22H26N2O2S2/c1-14-9-12-27-20(14)16(21-15(2)10-13-28-21)6-5-11-24(3)17-7-4-8-18-19(17)22(25)23-26-18/h6,9-10,12-13,17H,4-5,7-8,11H2,1-3H3,(H,23,25) |
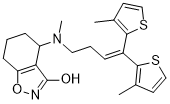
| Chemical Name | (RS)-4-[N-[1,1-bis(3-methyl-2-thienyl)but-1-en-4-yl]-N-methylamino]-4,5,6,7-tetrahydrobenzo[d]isoxazol-3-ol |
| Synonyms | EF1502; EF-1502; EF 1502; EF1502 free base; CHEMBL1773934; 684645-54-3 (free base); 684645-54-3; (rs)-4-[n-[1,1-bis(3-methyl-2-thienyl)but-1-en-4-yl]-n-methylamino]-4,5,6,7-tetrahydrobenzo[d]isoxazol-3-ol; 4-[4,4-bis(3-methylthiophen-2-yl)but-3-enyl-methylamino]-4,5,6,7-tetrahydro-1,2-benzoxazol-3-one; (R,S)-EF 1502; Rac-EF 1502 |
| HS Tariff Code | 2934.99.9001 |
| Storage |
Powder-20°C 3 years 4°C 2 years In solvent -80°C 6 months -20°C 1 month |
| Shipping Condition | Room temperature (This product is stable at ambient temperature for a few days during ordinary shipping and time spent in Customs) |
Biological Activity
| Targets | GABA transporter; GAT1; BGT1 |
| ln Vivo |
Modulation of the extracellular levels of GABA via inhibition of the synaptic GABA transporter GAT1 by the clinically effective and selective GAT1 inhibitor tiagabine [(R)-N-[4,4-bis(3-methyl-2-thienyl)-3-butenyl]nipecotic acid; Gabitril] has proven to be an effective treatment strategy for focal seizures. Even though less is known about the therapeutic potential of other GABA transport inhibitors, previous investigations have demonstrated that N-[4,4-bis(3-methyl-2-thienyl)-3-butenyl]-3-hydroxy-4-(methylamino)-4,5,6,7-tetrahydrobenzo[d]isoxazol-3-ol (EF1502), which, like tiagabine, is inactive on GABA(A) receptors, inhibits both GAT1 and the extrasynaptic GABA and betaine transporter BGT1, and exerts a synergistic anticonvulsant effect when tested in combination with tiagabine. In the present study, the anticonvulsant activity and motor impairment associated with systemic administration of gaboxadol (4,5,6,7-tetrahydroisoxazolo[5,4-c]pyridin-3-ol), which, at the doses used in this study (i.e., 1-5 mg/kg) selectively activates extrasynaptic α4-containing GABA(A) receptors, was determined alone and in combination with either tiagabine or EF1502 using Frings audiogenic seizure-susceptible and CF1 mice. EF1502, when administered in combination with gaboxadol, resulted in reduced anticonvulsant efficacy and Rotarod impairment associated with gaboxadol. In contrast, tiagabine, when administered in combination with gaboxadol, did not modify the anticonvulsant action of gaboxadol or reverse its Rotarod impairment. Taken together, these results highlight the mechanistic differences between tiagabine and EF1502 and support a functional role for BGT1 and extrasynaptic GABA(A) receptors. [1] Acute Anticonvulsant Activity in Frings AGS-Susceptible Mice. [1] Table 1 summarizes the anticonvulsant results obtained for gaboxadol, tiagabine, and EF1502 in AGS-susceptible Frings mice. All three compounds were found to produce an anticonvulsant effect in this mouse model of sensory evoked seizures. Isobologram Studies. [1] The experimental and theoretical results obtained from several fixed-dose combination studies are summarized in Table 2. The calculations of the theoretical ED50, add ± S.E.M. and experimental ED50, exp ± S.E.M. are described above. As explained under Materials and Methods, the slope function of the drugs in the mixture must be parallel for proper isobolographic analysis. In the present study, the slope functions of gaboxadol, tiagabine, and EF1502 were not significantly different from each other and thus met the criteria for isobolographic analysis (data not shown). As summarized in Table 2 and shown graphically in Fig. 1A, the combination of gaboxadol and tiagabine exhibited an additive interaction, whereas the combination of gaboxadol and EF1502 (Fig. 1B) displayed an antagonistic interaction. Ataxia. [1] At a dose of 5 mg/kg, gaboxadol displayed a time-dependent motor impairment in the Rotarod test (Fig. 2, A and B). On the basis of the hypothesis that elevation of ambient GABA levels would lead to the displacement of gaboxadol from its binding site at the α4 GABAA-R, combination studies were conducted with the GAT1 selective inhibitor tiagabine and the mixed GAT1/BGT1 inhibitor EF1502. As shown in Fig. 2A, tiagabine at two different doses (1 and 1.5 mg/kg) did not significantly ameliorate the motor impairment induced by gaboxadol. Contrary to the lack of effect of tiagabine, EF1502 at two different doses (10 and 15 mg/kg) significantly (p < 0.05) attenuated the motor impairment associated with gaboxadol (Fig. 2B). |
| Animal Protocol |
The test substances, EF1502, tiagabine, and gaboxadol were injected intraperitoneally and evaluated for antiseizure activity. First, the time-to-peak effect (TPE) was established by administration of a submaximal anticonvulsant dose to groups of four animals, which were tested at various time points (15, 30, 60, and 120 min) after drug administration. Thereafter, a dose-response curve was established at the predetermined TPE by giving animals injections (n = 8 mice/dose level) of varying doses of the test drug until at least two doses were established between the limits of 0 and 100% protection. The ED50 and the corresponding 95% confidence interval (CI) were calculated using data from the dose-response study, which was analyzed using probit analysis as described by Finney (1971). Gaboxadol was used in an isobologram study in combination with EF1502 or tiagabine to evaluate the resulting anticonvulsant interaction, which can be synergistic, additive, or antagonistic.[1] If the 95% CI is not symmetric around the ED50 on the log scale, eqs. 1a and 1b are used to calculate the S.E.M. (logED50, add) when antagonistic or synergistic interactions, respectively, are evaluated. The factor f1 corresponds to the fraction of drug 1 in the mixture; hence, f1 = 1/4 in the 1:3 fixed-ratio mixture. The degree of freedom of V(ED50, add) is given by Nadd = N1 + N2 − 4. Furthermore, as described above, the drugs were injected in a staggered fashion in such a manner that anticonvulsant testing in the Frings AGS-susceptible mouse was conducted at the previously determined TPE for tiagabine and EF1502 (White et al., 2005).[1] Ataxia: In wild-type mice, 10 mg/kg gaboxadol induces ataxia, whereas in α4 GABAA-R knockout mice, gaboxadol is without effect on motor function (Chandra et al., 2006). These results support the concept that gaboxadol is exerting its effects primarily through a direct activation of α4-containing GABAA receptors, which are thought to be located extrasynaptically (Nusser and Mody, 2002). In the present investigation, 5 mg/kg gaboxadol was found to produce a degree of ataxia comparable to that reported by Chandra et al. (2006). Ataxia was measured by placing CF1 mice on a fixed-speed Rotarod (6 rpm) and monitoring their performance for 180 s at various time points (15, 30, 45, 60, 75, and 90 min) after gaboxadol administration. The degree of ataxia was measured as the latency before the mouse fell off the rotating rod. Mice unable to complete a 180-s trial run on the Rotarod (6 rpm) when tested 3 h before the experiment were excluded from further study. Several combination studies to evaluate the interaction at this dose of gaboxadol, i.e., 5 mg/kg, and the GABA transport inhibitors tiagabine and EF1502 were performed. Tiagabine, at doses of 1 and 1.5 mg/kg, was combined with 5 mg/kg gaboxadol and similarly EF1502, at doses of 10 and 15 mg/kg, was combined with 5 mg/kg gaboxadol. Rotarod testing was performed at the time-to-peak effect for each of the drugs administered; i.e., 15, 30, and 60 min for gaboxadol, EF1502, and tiagabine, respectively. For example, tiagabine was administered 45 min before gaboxadol and the Rotarod test was performed 15 min later. It is important to note that no Rotarod impairment was observed at the doses of EF1502 and tiagabine tested (White et al., 2005). Recovery from ataxia induced by 5 mg/kg gaboxadol in the presence of EF1502 and tiagabine was evaluated using a two-way repeated-measures analysis of variance to the control the values observed when gaboxadol was administered alone. Statistical analysis was performed using SigmaPlot 9.0 [1]. |
| References | [1]. Selective GABA transporter inhibitors tiagabine and EF1502 exhibit mechanistic differences in their ability to modulate the ataxia and anticonvulsant action of the extrasynaptic GABA(A) receptor agonist gaboxadol. J Pharmacol Exp Ther. 2011 Jul;338(1):214-9. |
| Additional Infomation |
Although not directly assessed in this study, the in vivo results obtained in the combination studies with EF1502 and gaboxadol support the conclusion that ambient extrasynaptic GABA levels were elevated. This conclusion is based on the demonstration that the in vivo action of gaboxadol was antagonized by EF1502. In contrast, tiagabine did not display an antagonist interaction with gaboxadol under the conditions in which it was studied. The differences between EF1502 and tiagabine can be explained on the basis of the anatomical location of their respective targets of action. For example, GAT1 is localized close to the synapse, whereas BGT1 is localized extrasynaptically (for review, see Madsen et al., 2010). Thus, tiagabine, which is a highly selective GAT1 inhibitor, would be expected to lead to a preferential increase in synaptic GABA levels over extrasynaptic GABA levels, whereas EF1502 by virtue of its ability to inhibit both GAT1 and BGT1 would be expected to increase both synaptic and extrasynaptic GABA concentrations. This does not suggest that there would not be some spillover of GABA to extrasynaptic sites after TGB administration; however, it would probably be minimal relative to that produced by the GAT1/BGT1 inhibitor EF1502. Unfortunately, it would be extremely difficult from a technical perspective to measure where the spillover is occurring, e.g., synaptic versus extrasynaptic, after TGB and EF1502 administration. thus, we are left to interpret the behavioral results in light of the anatomical studies that have been conducted, and although the interpretation is open to criticism, the results support the current working hypothesis and emphasize the need for additional investigation. In summary, the approach used in this study clearly highlights the differences in the mechanistic and functional profile of tiagabine and EF1502 and their respective molecular targets. Nonetheless, any final conclusion regarding the overall role of extrasynaptic GABA transporters such as BGT1 will have to await the design and development of highly selective inhibitors that target these transporters.[1] |
Solubility Data
| Solubility (In Vitro) | May dissolve in DMSO (in most cases), if not, try other solvents such as H2O, Ethanol, or DMF with a minute amount of products to avoid loss of samples |
| Solubility (In Vivo) |
Note: Listed below are some common formulations that may be used to formulate products with low water solubility (e.g. < 1 mg/mL), you may test these formulations using a minute amount of products to avoid loss of samples. Injection Formulations (e.g. IP/IV/IM/SC) Injection Formulation 1: DMSO : Tween 80: Saline = 10 : 5 : 85 (i.e. 100 μL DMSO stock solution → 50 μL Tween 80 → 850 μL Saline) *Preparation of saline: Dissolve 0.9 g of sodium chloride in 100 mL ddH ₂ O to obtain a clear solution. Injection Formulation 2: DMSO : PEG300 :Tween 80 : Saline = 10 : 40 : 5 : 45 (i.e. 100 μL DMSO → 400 μLPEG300 → 50 μL Tween 80 → 450 μL Saline) Injection Formulation 3: DMSO : Corn oil = 10 : 90 (i.e. 100 μL DMSO → 900 μL Corn oil) Example: Take the Injection Formulation 3 (DMSO : Corn oil = 10 : 90) as an example, if 1 mL of 2.5 mg/mL working solution is to be prepared, you can take 100 μL 25 mg/mL DMSO stock solution and add to 900 μL corn oil, mix well to obtain a clear or suspension solution (2.5 mg/mL, ready for use in animals). Injection Formulation 4: DMSO : 20% SBE-β-CD in saline = 10 : 90 [i.e. 100 μL DMSO → 900 μL (20% SBE-β-CD in saline)] *Preparation of 20% SBE-β-CD in Saline (4°C,1 week): Dissolve 2 g SBE-β-CD in 10 mL saline to obtain a clear solution. Injection Formulation 5: 2-Hydroxypropyl-β-cyclodextrin : Saline = 50 : 50 (i.e. 500 μL 2-Hydroxypropyl-β-cyclodextrin → 500 μL Saline) Injection Formulation 6: DMSO : PEG300 : castor oil : Saline = 5 : 10 : 20 : 65 (i.e. 50 μL DMSO → 100 μLPEG300 → 200 μL castor oil → 650 μL Saline) Injection Formulation 7: Ethanol : Cremophor : Saline = 10: 10 : 80 (i.e. 100 μL Ethanol → 100 μL Cremophor → 800 μL Saline) Injection Formulation 8: Dissolve in Cremophor/Ethanol (50 : 50), then diluted by Saline Injection Formulation 9: EtOH : Corn oil = 10 : 90 (i.e. 100 μL EtOH → 900 μL Corn oil) Injection Formulation 10: EtOH : PEG300:Tween 80 : Saline = 10 : 40 : 5 : 45 (i.e. 100 μL EtOH → 400 μLPEG300 → 50 μL Tween 80 → 450 μL Saline) Oral Formulations Oral Formulation 1: Suspend in 0.5% CMC Na (carboxymethylcellulose sodium) Oral Formulation 2: Suspend in 0.5% Carboxymethyl cellulose Example: Take the Oral Formulation 1 (Suspend in 0.5% CMC Na) as an example, if 100 mL of 2.5 mg/mL working solution is to be prepared, you can first prepare 0.5% CMC Na solution by measuring 0.5 g CMC Na and dissolve it in 100 mL ddH2O to obtain a clear solution; then add 250 mg of the product to 100 mL 0.5% CMC Na solution, to make the suspension solution (2.5 mg/mL, ready for use in animals). Oral Formulation 3: Dissolved in PEG400 Oral Formulation 4: Suspend in 0.2% Carboxymethyl cellulose Oral Formulation 5: Dissolve in 0.25% Tween 80 and 0.5% Carboxymethyl cellulose Oral Formulation 6: Mixing with food powders Note: Please be aware that the above formulations are for reference only. InvivoChem strongly recommends customers to read literature methods/protocols carefully before determining which formulation you should use for in vivo studies, as different compounds have different solubility properties and have to be formulated differently. (Please use freshly prepared in vivo formulations for optimal results.) |
| Preparing Stock Solutions | 1 mg | 5 mg | 10 mg | |
| 1 mM | 2.4121 mL | 12.0604 mL | 24.1208 mL | |
| 5 mM | 0.4824 mL | 2.4121 mL | 4.8242 mL | |
| 10 mM | 0.2412 mL | 1.2060 mL | 2.4121 mL |