Physicochemical Properties
| Molecular Formula | C20H28O2 |
| Molecular Weight | 300.4351 |
| Exact Mass | 300.208 |
| CAS # | 1740-19-8 |
| PubChem CID | 94391 |
| Appearance | White to yellow solid powder |
| Density | 1.1±0.1 g/cm3 |
| Boiling Point | 425.1±34.0 °C at 760 mmHg |
| Melting Point | 174-176ºC |
| Flash Point | 202.5±20.3 °C |
| Vapour Pressure | 0.0±1.1 mmHg at 25°C |
| Index of Refraction | 1.540 |
| LogP | 6.35 |
| Hydrogen Bond Donor Count | 1 |
| Hydrogen Bond Acceptor Count | 2 |
| Rotatable Bond Count | 2 |
| Heavy Atom Count | 22 |
| Complexity | 443 |
| Defined Atom Stereocenter Count | 3 |
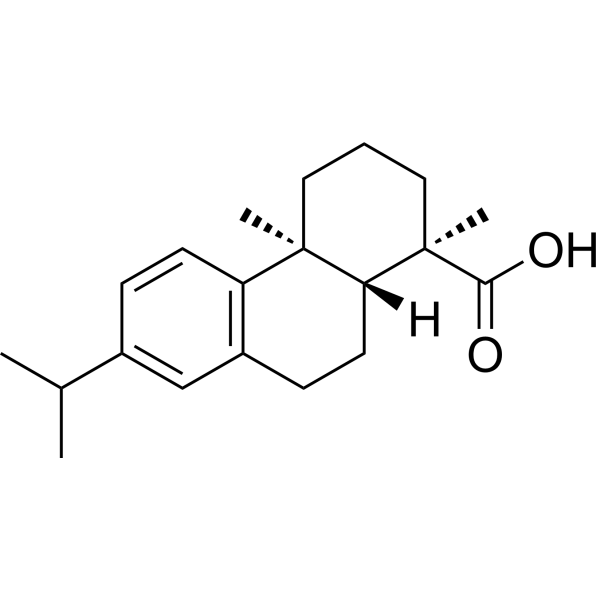
| SMILES | CC(C)C1=CC2=C(C=C1)[C@]3(CCC[C@@]([C@@H]3CC2)(C)C(=O)O)C |
| InChi Key | NFWKVWVWBFBAOV-MISYRCLQSA-N |
| InChi Code | InChI=1S/C20H28O2/c1-13(2)14-6-8-16-15(12-14)7-9-17-19(16,3)10-5-11-20(17,4)18(21)22/h6,8,12-13,17H,5,7,9-11H2,1-4H3,(H,21,22)/t17-,19-,20-/m1/s1 |
| Chemical Name | (1R,4aS,10aR)-1,4a-dimethyl-7-propan-2-yl-2,3,4,9,10,10a-hexahydrophenanthrene-1-carboxylic acid |
| HS Tariff Code | 2934.99.9001 |
| Storage |
Powder-20°C 3 years 4°C 2 years In solvent -80°C 6 months -20°C 1 month Note: This product requires protection from light (avoid light exposure) during transportation and storage. |
| Shipping Condition | Room temperature (This product is stable at ambient temperature for a few days during ordinary shipping and time spent in Customs) |
Biological Activity
| ln Vitro |
In lipopolysaccharide (LPS)-stimulated RAW264.7 murine macrophage cells, pretreatment with Dehydroabietic acid (100 µM) for 30 minutes significantly reduced nitric oxide (NO) production after 24 hours of LPS (1 µg/mL) induction.[1] Semiquantitative PCR analysis showed that in LPS-stimulated RAW264.7 cells, pretreatment with 100 µM Dehydroabietic acid for 30 minutes markedly reduced the mRNA expression levels of inflammatory genes including inducible nitric oxide synthase (iNOS) and tumor necrosis factor-alpha (TNF-α) after 6 hours. The expression of cyclooxygenase-2 (COX-2) was also slightly decreased.[1] In HEK293T cells transfected with the TLR4 adaptor molecule MyD88, treatment with 100 µM Dehydroabietic acid for 24 hours significantly suppressed both NF-κB- and AP-1-mediated luciferase reporter activity, indicating inhibition at the transcriptional level.[1] Western blot analysis in LPS-stimulated RAW264.7 cells revealed that pretreatment with 100 µM Dehydroabietic acid suppressed the phosphorylation of IκBα and IKKα/β in the NF-κB pathway in a time-dependent manner (up to 60 minutes).[1] Furthermore, in the NF-κB cascade, Dehydroabietic acid (100 µM) pretreatment inhibited the early phosphorylation (activation) of Src (at 3 minutes) and Syk (at 3 and 5 minutes) kinases following LPS stimulation in RAW264.7 cells.[1] In HEK293T cells overexpressing Myc-Syk or HA-Src, treatment with 100 µM Dehydroabietic acid for 24 hours reduced the phosphorylation levels of the overexpressed Syk and Src kinases, respectively, confirming them as molecular targets.[1] In the AP-1 signaling pathway, pretreatment with 100 µM Dehydroabietic acid in LPS-stimulated RAW264.7 cells suppressed the phosphorylation of c-Jun N-terminal kinase (JNK) in a time-dependent manner (up to 240 minutes), but did not affect the phosphorylation of p38 or extracellular signal-regulated kinase (ERK).[1] The phosphorylation of upstream kinases MKK4 and MKK7, which activate JNK, was also inhibited by Dehydroabietic acid pretreatment at 60, 120, and 240 minutes post-LPS stimulation.[1] In HEK293T cells overexpressing HA-TAK1, treatment with 100 µM Dehydroabietic acid for 24 hours suppressed the TAK1-mediated phosphorylation of MKK4 and MKK7, identifying TAK1 as a target in the AP-1 cascade.[1] Molecular docking studies suggested that Dehydroabietic acid formed stable hydrogen bonds with the ligand-binding domains (LBD) of both PPAR-γ (with ARC280) and PPAR-α (with ARC465 and LYS448), with lower calculated binding energy than its analogue abietic acid (AA).[2] In HEK293T cells transfected with PPAR-γ or PPAR-α reporter constructs, treatment with Dehydroabietic acid (concentration range 2.5–50 µM) activated both PPAR-γ and PPAR-α in a dose-dependent manner. It was identified as a partial agonist of PPAR-γ (achieving about 1/4 of the maximum activity of the full agonist rosiglitazone at the same dose) and a dual PPAR-α/γ agonist.[2] In pre-adipocyte 3T3-L1 cells, treatment with Dehydroabietic acid (2.5–15 µM) during the differentiation process promoted adipocyte differentiation and intracellular lipid deposition in a dose-dependent manner, as evidenced by Oil Red O staining.[2] During 3T3-L1 differentiation, Dehydroabietic acid (10 µM) increased the mRNA expression of PPAR-γ target genes involved in glucose uptake and metabolism, such as Glut-4 and Cyp4a10, similar to the effect of rosiglitazone (20 µM).[2] In fully differentiated 3T3-L1 adipocytes, treatment with 10 µM Dehydroabietic acid for 24 hours upregulated the mRNA expression of several PPAR-γ target genes (e.g., CEBPB, FABP4, 11β-HSD1, PDK4) and metabolic regulators (e.g., adiponectin, ANGPTL4, leptin, FGF21), while downregulating inflammatory adipokines (ANGPTL2, RARRES2).[2] In human liver HL7702 cells, treatment with Dehydroabietic acid (2.5–10 µM) reduced oleic acid-induced intracellular lipid accumulation, as shown by Nile Red staining and electron microscopy. This effect was blocked by the PPAR-α antagonist GW6471, indicating it is PPAR-α mediated.[2] In HL7702 cells, Dehydroabietic acid (2.5–10 µM) increased the mitochondrial oxygen consumption rate (OCR), including basal respiration and ATP production, as measured by Seahorse bioanalyzer. This effect was partially reversed by GW6471.[2] In HL7702 cells, Dehydroabietic acid (2.5–10 µM) upregulated the mRNA expression of classical PPAR-α target genes involved in fatty acid β-oxidation, including CPT-1α, ACDAL, and UCP-3.[2] |
| ln Vivo |
In male C57BL/6J mice fed a high-fat diet (HFD) for 12 weeks to induce obesity and insulin resistance, oral gavage of Dehydroabietic acid (10 or 20 mg/kg/day, termed DA-L and DA-H) for 9 weeks significantly reduced the body weight gain caused by HFD in a dose-dependent manner, unlike rosiglitazone (4 mg/kg/day).[2] Dehydroabietic acid treatment (especially the high dose, 20 mg/kg/day) ameliorated HFD-induced fasting hyperglycemia and improved glucose tolerance during an oral glucose tolerance test (OGTT).[2] Dehydroabietic acid treatment (10 and 20 mg/kg/day) improved systemic insulin sensitivity during an insulin tolerance test (ITT), showing effects similar to rosiglitazone.[2] The hypoglycemic and insulin-sensitizing effects of Dehydroabietic acid were shown to be dependent on PPAR-γ activation, as they were blocked by co-administration of the PPAR-γ antagonist GW9662 in HFD-fed mice.[2] Dehydroabietic acid treatment alleviated HFD-induced hepatic steatosis (fatty liver), as evidenced by reduced liver fat deposition in gross anatomy, lower NAFLD activity score (NAS) in histological analysis (H&E staining), and decreased liver injury markers (plasma ALT and AST levels) in a dose-dependent manner. It performed better than rosiglitazone in improving these parameters.[2] Dehydroabietic acid treatment improved dyslipidemia in HFD-fed mice by significantly lowering plasma levels of triglycerides (TG), total cholesterol (TC), and low-density lipoprotein cholesterol (LDL-c), while increasing high-density lipoprotein cholesterol (HDL-c).[2] In the liver tissue of HFD-fed mice, Dehydroabietic acid treatment increased the protein expression (by immunohistochemistry) and mRNA levels of PPAR-α and its downstream targets involved in fatty acid β-oxidation, such as ACADM and CPT1α.[2] Dehydroabietic acid treatment dose-dependently reduced the hepatic mRNA expression of pro-inflammatory cytokines, including IL-1β, IL-6, TNF-α, COX-1, and COX-2.[2] In white adipose tissue (WAT) of HFD-fed mice, Dehydroabietic acid (20 mg/kg/day) reduced adipocyte size and upregulated mRNA expression of PPAR-γ and its target genes (Glut-4, AdipoR, FSP27, ACOX-1, FABP4, adiponectin). It also downregulated mRNA expression of inflammatory cytokines (IL-1β, IL-6, TNF-α).[2] In brown adipose tissue (BAT) of HFD-fed mice, Dehydroabietic acid (20 mg/kg/day) normalized the protein level of uncoupling protein 1 (UCP-1), suggesting enhanced thermogenesis.[2] |
| Cell Assay |
Nitric Oxide (NO) Production (Griess Assay): RAW264.7 cells were seeded in a 96-well plate overnight. Cells were pretreated with various concentrations of Dehydroabietic acid (0-100 µM) for 30 minutes, followed by stimulation with or without LPS (1 µg/mL) for 24 hours. The cell culture supernatants were then collected, and NO production was determined by mixing the supernatant with Griess reagent and measuring the absorbance.[1] Cell Viability Assay (MTT): RAW264.7 or HEK293T cells were seeded in a 96-well plate. After attachment, cells were treated with Dehydroabietic acid (0-100 µM) for 24 hours. An MTT solution was then added to each well and incubated for a specified time. The formed formazan crystals were dissolved, and the absorbance was measured to assess cell viability.[1] Propidium Iodide (PI) Staining for Cytotoxicity: HEK293T cells were treated with Dehydroabietic acid (0-100 µM) for 24 hours. Cells were then stained with propidium iodide and analyzed by flow cytometry to determine the percentage of dead cells.[1] Semiquantitative Reverse Transcription PCR (RT-PCR): RAW264.7 cells were pretreated with Dehydroabietic acid for 30 minutes and then stimulated with LPS for 6 hours. Total RNA was isolated using TRIzol reagent. cDNA was synthesized from the RNA via reverse transcription. PCR amplification was performed using specific primers for iNOS, TNF-α, COX-2, and GAPDH (as a housekeeping control). The PCR products were analyzed by agarose gel electrophoresis.[1] Luciferase Reporter Assay: HEK293T cells were seeded in a 24-well plate. The cells were co-transfected with a plasmid encoding Flag-MyD88, along with either an NF-κB-Luc or an AP-1-Luc reporter construct, and a β-galactosidase plasmid as an internal control. After 24 hours of transfection, cells were treated with Dehydroabietic acid (0-100 µM) for an additional 24 hours. Cell lysates were prepared, and both luciferase and β-galactosidase activities were measured. Luciferase activity was normalized to β-galactosidase activity to determine the effect on transcriptional activation.[1] Western Blot Analysis: Cells (RAW264.7 or transfected HEK293T) were pretreated with Dehydroabietic acid and stimulated with LPS or left untreated for various time points. Cells were washed, harvested, and lysed. Protein concentration was determined, and equal amounts of protein were separated by SDS-PAGE and transferred to a membrane. The membrane was blocked and then incubated with primary antibodies against target proteins (e.g., phospho- or total forms of IκBα, IKKα/β, Src, Syk, JNK, p38, ERK, MKK4, MKK7, TAK1, HA, Myc, Flag, β-actin). After washing, the membrane was incubated with a horseradish peroxidase-conjugated secondary antibody. Protein bands were visualized using an enhanced chemiluminescence detection system.[1] Plasmid Transfection for Overexpression Studies: HEK293T cells were seeded in plates and transfected with plasmids encoding Myc-Syk, HA-Src, or HA-TAK1 using a transfection reagent. After 24 hours of transfection to allow protein expression, cells were treated with Dehydroabietic acid (0-100 µM) for an additional 24 hours. Cell lysates were then prepared for Western blot analysis to assess the phosphorylation status of the overexpressed kinases.[1] Cell Viability Assay (MTT): 3T3-L1 pre-adipocytes or HL7702 human liver cells were seeded in plates. After attachment, cells were treated with various concentrations of Dehydroabietic acid or abietic acid (AA) for a specified period. An MTT solution was added to each well and incubated. The formed formazan crystals were dissolved, and the absorbance was measured to assess cell viability.[2] PPAR Transcriptional Activity (Luciferase Reporter Assay): HEK293T cells were seeded in 96-well plates and transfected with plasmids expressing full-length PPAR-γ or PPAR-α along with a corresponding PPAR-responsive luciferase reporter vector (J3-TKLuc). Alternatively, cells were transfected with a plasmid expressing a GAL4-PPAR-LBD (ligand-binding domain) fusion protein and a pGL4.35 reporter vector. A β-galactosidase reporter was co-transfected for normalization. After transfection, cells were treated with Dehydroabietic acid, abietic acid, or reference compounds (rosiglitazone) at indicated concentrations for 24 hours. Cell lysates were prepared, and both luciferase and β-galactosidase activities were measured. Luciferase activity was normalized to β-galactosidase activity to determine PPAR activation.[2] 3T3-L1 Adipocyte Differentiation and Oil Red O Staining: 3T3-L1 pre-adipocytes were grown to confluence in culture plates. Differentiation was induced with a cocktail containing insulin and dexamethasone. After two days, the medium was switched to a maintenance medium containing insulin along with different test compounds (e.g., rosiglitazone, Dehydroabietic acid). The medium was refreshed every two days. On day 6 of differentiation, cells were fixed and stained with Oil Red O solution to visualize lipid droplets. For quantification, the stained Oil Red O was extracted with isopropanol and its absorbance was measured at 500 nm.[2] Intracellular Lipid Accumulation Assay (Nile Red Staining): HL7702 cells were seeded in plates and treated with oleic acid to induce lipid accumulation, along with test compounds (Dehydroabietic acid, PPAR-α agonist WY14643, or Dehydroabietic acid combined with PPAR-α antagonist GW6471) for 24 hours. Cells were then stained with Nile Red dye, which fluoresces upon binding to neutral lipids, and visualized under a fluorescence microscope. Fluorescence intensity was quantified to assess lipid content.[2] Transmission Electron Microscopy (TEM) for Lipid Droplets: HL7702 cells treated as described above were processed for TEM analysis. Cells were fixed, dehydrated, embedded, sectioned, and stained. The sections were examined under a transmission electron microscope to visualize and measure the area of intracellular lipid droplets.[2] Mitochondrial Oxygen Consumption Rate (OCR) Measurement (Seahorse Assay): HL7702 cells were seeded in a specialized Seahorse microplate coated with collagen. Cells were treated with test compounds for approximately 23 hours prior to the assay. On the day of the assay, the culture medium was replaced with assay medium. Using a Seahorse bioanalyzer, OCR was measured under basal conditions and sequentially after injection of oligomycin (ATP synthase inhibitor), FCCP (mitochondrial uncoupler), and a mixture of rotenone and antimycin A (complex I and III inhibitors). Parameters such as basal respiration, ATP production, and maximal respiratory capacity were calculated from the OCR profile.[2] Quantitative Real-Time PCR (qRT-PCR): Total RNA was extracted from cells (e.g., differentiating 3T3-L1, treated HL7702) or tissues (liver, adipose) using TRIzol reagent. RNA was reverse transcribed into cDNA. Quantitative PCR was performed using SYBR Green chemistry and specific primers for target genes (e.g., Glut-4, Cyp4a10, Scd-1, adiponectin, CPT-1α, inflammatory cytokines) and a housekeeping gene (GAPDH). Gene expression levels were calculated using the 2^(-ΔΔCt) method relative to the control group.[2] Immunohistochemistry (IHC): Liver, white adipose, and brown adipose tissues from mice were fixed, paraffin-embedded, and sectioned. Tissue sections were deparaffinized, rehydrated, and subjected to antigen retrieval. After blocking, sections were incubated with primary antibodies against target proteins (e.g., PPAR-α, ACADM, CPT1α, UCP-1) overnight. After washing, sections were incubated with a suitable secondary antibody conjugated to an enzyme (e.g., HRP). The signal was developed using a chromogenic substrate (DAB), and sections were counterstained, dehydrated, and mounted. Staining intensity and area were quantified using image analysis software.[2] |
| Animal Protocol |
High-Fat Diet (HFD)-Induced Obesity and Insulin Resistance Model: Eight-week-old male C57BL/6J mice were fed either a normal chow diet (NCD) or a high-fat diet (HFD, 60% kcal from fat) for 12 weeks to induce obesity, insulin resistance, and hepatic steatosis.[2] Drug Treatment: After 12 weeks of diet induction, HFD-fed mice were randomly divided into treatment groups. Dehydroabietic acid was suspended in 0.5% sodium carboxymethylcellulose (CMC-Na). Mice were administered the drug once daily via oral gavage for 9 consecutive weeks. Two doses were used: a low dose (DA-L, 10 mg/kg/day) and a high dose (DA-H, 20 mg/kg/day). The positive control group received rosiglitazone (4 mg/kg/day), and the HFD control group received an equal volume of vehicle (0.5% CMC-Na). The NCD control group also received 0.5% CMC-Na.[2] Metabolic Tests: Oral Glucose Tolerance Test (OGTT): Performed after 4 days of recovery from ITT, following a 12-hour fast. Mice were orally administered glucose (2 g/kg body weight). Blood glucose levels were measured from the tail vein at 0, 15, 30, 60, 90, and 120 minutes post-administration using a glucometer.[2] Insulin Tolerance Test (ITT): Performed after 7 weeks of treatment, following a 6-hour fast. Mice were intraperitoneally injected with insulin (1 IU/kg body weight). Blood glucose levels were measured from the tail vein at 0, 30, 60, 90, 120, and 150 minutes post-injection.[2] Tissue Collection: At the end of the treatment period (after 9 weeks), mice were euthanized. Blood was collected for plasma preparation. Liver, epididymal white adipose tissue (WAT), and interscapular brown adipose tissue (BAT) were rapidly dissected. Tissues were either fixed in 4% paraformaldehyde for histology or snap-frozen in liquid nitrogen and stored at -80°C for RNA and protein analysis.[2] |
| Toxicity/Toxicokinetics |
In vitro cytotoxicity assays indicated that Dehydroabietic acid at concentrations up to 100 µM was not toxic to RAW264.7 murine macrophage cells or HEK293T human embryonic kidney cells after 24 hours of treatment, as assessed by MTT assay.[1] Propidium iodide staining followed by flow cytometry analysis confirmed that treatment with Dehydroabietic acid (up to 100 µM) for 24 hours did not induce significant cell death in HEK293T cells.[1] In vitro cytotoxicity assays (MTT) indicated that Dehydroabietic acid showed minimal toxicity to 3T3-L1 pre-adipocytes and HL7702 human liver cells at concentrations up to 100 µM, and was less toxic than its analogue abietic acid (AA) at the same concentrations.[2] In HFD-fed mice, 9-week oral administration of Dehydroabietic acid (10 or 20 mg/kg/day) did not show signs of systemic toxicity and, in contrast to rosiglitazone, significantly reduced the elevated plasma levels of liver injury markers alanine aminotransferase (ALT) and aspartate aminotransferase (AST), indicating a hepatoprotective effect against HFD-induced damage.[2] |
| References |
[1]. Dehydroabietic Acid Suppresses Inflammatory Response Via Suppression of Src-, Syk-, and TAK1-Mediated Pathways. Int J Mol Sci. 2019 Mar 29;20(7):1593. [2]. Dehydroabietic acid alleviates high fat diet-induced insulin resistance and hepatic steatosis through dual activation of PPAR-γ and PPAR-α. Biomed Pharmacother. 2020 Jul;127:110155. |
| Additional Infomation |
Dehydroabietic acid is an abietane diterpenoid that is abieta-8,11,13-triene substituted at position 18 by a carboxy group. It has a role as a metabolite and an allergen. It is an abietane diterpenoid, a monocarboxylic acid and a carbotricyclic compound. It is functionally related to an abietic acid. It is a conjugate acid of a dehydroabietate. Dehydroabietic acid has been reported in Pinus densiflora, Pinus pinea, and other organisms with data available. Dehydroabietic acid is a naturally occurring diterpene resin acid derived from coniferous plants like Pinus and Picea.[1] The study demonstrates that the anti-inflammatory mechanism of Dehydroabietic acid involves the suppression of multiple signaling pathways. It targets and inhibits the kinases Src and Syk in the NF-κB cascade, and TAK1 in the AP-1 cascade, leading to reduced phosphorylation of downstream signaling molecules (IκBα/IKK, JNK/MKKs), subsequent inhibition of transcriptional activities of NF-κB and AP-1, and ultimately downregulation of inflammatory mediators like NO, iNOS, and TNF-α.[1] The findings suggest that Dehydroabietic acid has potential as a natural compound for developing drugs or supplements aimed at ameliorating inflammatory conditions.[1] Dehydroabietic acid is a naturally occurring diterpene resin acid derived from coniferous plants and is also found as a residue in ducks due to the use of rosin in feather plucking.[2] This study identifies Dehydroabietic acid as a novel dual agonist of PPAR-α and PPAR-γ, with partial agonist activity on PPAR-γ. Its mechanism of ameliorating high-fat diet-induced insulin resistance and hepatic steatosis involves dual activation of these nuclear receptors, leading to improved glucose uptake and adipocyte function (via PPAR-γ), enhanced fatty acid β-oxidation and mitochondrial function (via PPAR-α), and suppression of tissue inflammation.[2] Compared to the classical PPAR-γ full agonist rosiglitazone, Dehydroabietic acid offers advantages in the context of obesity-related metabolic disorders by promoting weight loss (rather than weight gain), providing better protection against hepatic steatosis and liver injury, and improving the overall blood lipid profile (reducing TG, TC, LDL-c; increasing HDL-c).[2] |
Solubility Data
| Solubility (In Vitro) | DMSO : ~100 mg/mL (~332.85 mM) |
| Solubility (In Vivo) |
Solubility in Formulation 1: 2.5 mg/mL (8.32 mM) in 10% DMSO + 40% PEG300 + 5% Tween80 + 45% Saline (add these co-solvents sequentially from left to right, and one by one), suspension solution; with sonication. For example, if 1 mL of working solution is to be prepared, you can add 100 μL of 25.0 mg/mL clear DMSO stock solution to 400 μL PEG300 and mix evenly; then add 50 μL Tween-80 to the above solution and mix evenly; then add 450 μL normal saline to adjust the volume to 1 mL. Preparation of saline: Dissolve 0.9 g of sodium chloride in 100 mL ddH₂ O to obtain a clear solution. Solubility in Formulation 2: 2.5 mg/mL (8.32 mM) in 10% DMSO + 90% (20% SBE-β-CD in Saline) (add these co-solvents sequentially from left to right, and one by one), suspension solution; with ultrasonication. For example, if 1 mL of working solution is to be prepared, you can add 100 μL of 25.0 mg/mL clear DMSO stock solution to 900 μL of 20% SBE-β-CD physiological saline solution and mix evenly. Preparation of 20% SBE-β-CD in Saline (4°C,1 week): Dissolve 2 g SBE-β-CD in 10 mL saline to obtain a clear solution. Solubility in Formulation 3: ≥ 2.5 mg/mL (8.32 mM) (saturation unknown) in 10% DMSO + 90% Corn Oil (add these co-solvents sequentially from left to right, and one by one), clear solution. For example, if 1 mL of working solution is to be prepared, you can add 100 μL of 25.0 mg/mL clear DMSO stock solution to 900 μL of corn oil and mix evenly. (Please use freshly prepared in vivo formulations for optimal results.) |
| Preparing Stock Solutions | 1 mg | 5 mg | 10 mg | |
| 1 mM | 3.3285 mL | 16.6423 mL | 33.2845 mL | |
| 5 mM | 0.6657 mL | 3.3285 mL | 6.6569 mL | |
| 10 mM | 0.3328 mL | 1.6642 mL | 3.3285 mL |