Physicochemical Properties
| Molecular Formula | C28H19CL2F2N3O4 |
| Molecular Weight | 570.4 |
| Exact Mass | 569.0720678 |
| CAS # | 2377187-09-0 |
| Appearance | Typically exists as Off-white to light yellow solid at room temperature |
| LogP | 4.9 |
| Hydrogen Bond Donor Count | 2 |
| Hydrogen Bond Acceptor Count | 7 |
| Rotatable Bond Count | 6 |
| Heavy Atom Count | 39 |
| Complexity | 1050 |
| Defined Atom Stereocenter Count | 0 |
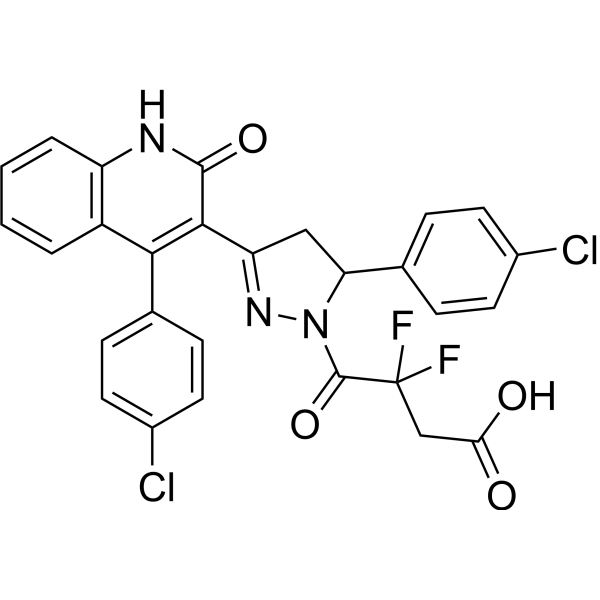
| SMILES | C1C(N(N=C1C2=C(C3=CC=CC=C3NC2=O)C4=CC=C(C=C4)Cl)C(=O)C(CC(=O)O)(F)F)C5=CC=C(C=C5)Cl |
| InChi Key | XJZPJUOPCITDPJ-UHFFFAOYSA-N |
| InChi Code | InChI=1S/C28H19Cl2F2N3O4/c29-17-9-5-15(6-10-17)22-13-21(34-35(22)27(39)28(31,32)14-23(36)37)25-24(16-7-11-18(30)12-8-16)19-3-1-2-4-20(19)33-26(25)38/h1-12,22H,13-14H2,(H,33,38)(H,36,37) |
| Chemical Name | 4-[3-(4-chlorophenyl)-5-[4-(4-chlorophenyl)-2-oxo-1H-quinolin-3-yl]-3,4-dihydropyrazol-2-yl]-3,3-difluoro-4-oxobutanoic acid |
| Synonyms | DQP-997-74; 2377187-09-0; SCHEMBL16339958; XJZPJUOPCITDPJ-UHFFFAOYSA-N; 4-[3-(4-chlorophenyl)-5-[4-(4-chlorophenyl)-2-oxo-1H-quinolin-3-yl]-3,4-dihydropyrazol-2-yl]-3,3-difluoro-4-oxobutanoic acid |
| HS Tariff Code | 2934.99.9001 |
| Storage |
Powder-20°C 3 years 4°C 2 years In solvent -80°C 6 months -20°C 1 month |
| Shipping Condition | Room temperature (This product is stable at ambient temperature for a few days during ordinary shipping and time spent in Customs) |
Biological Activity
| Targets | IC50: 0.069 μM (GluN2C), 0.035 μM (GluN2D), 5.2 μM (GluN2A), 16 μM (GluN2B)[1] |
| ln Vitro |
Researchers preincubated cells with glycine and the inhibitor 2i (DQP-997-74) and compared inhibitor potency during the peak and steady-state current responses to glutamate application. Preincubation of the inhibitor produced a reduction in the peak current, suggesting that 2i could bind to receptors in the absence of glutamate to inhibit the peak current the moment glutamate binds and the channel is activated. The IC50 for compound 2i was 3-fold higher during the peak current responses (IC50 0.23 μM) compared to steady-state responses (IC50 0.08; Figure 4B,C; Table 2), suggesting increased affinity for 2i following glutamate binding, which allowed 2i to re-equilibrate with the NMDAR producing a time-dependent inhibition that reflected the time course of inhibitor binding. To investigate the time course of 2i inhibition, we fitted the relaxation of the current response with a single exponential function. If the current response time course reflects 2i binding, then the reciprocal of τinhibition should be linearly related to its concentration, with the slope equal to kON and intercept equal to kOFF. The exponential time course of the current response was correlated with compound 2i concentration (R2 = 0.82), and linear regression analysis yielded values of 4.0 × 10⁵ M–1 s–1 for kON and 0.17 s–1 for kOFF (Figure 4D), suggesting a KD value of 0.43 μM. The deactivation of GluN1/GluN2D receptors (5.3 ± 0.2 s) was slowed by the presence of compound 2i when applied at concentrations of 0.1 μM (7.3 ± 0.3 s; p = 0.017) and 0.3 μM (10.5 ± 1.0 s; p = 0.002) but not at 0.03 μM (5.6 ± 0.3 s; p = 0.518; Figure 4E). These data suggest that glutamate unbinding was slowed in the presence of 2i. This phenomenon was previously discovered for QNZ-46, a glutamate-dependent GluN2C/2D-selective inhibitor with a different structural core.42 As proposed in that study, the prolonged deactivation may indicate that 2i slows a conformational change necessary for glutamate unbinding or 2i may need to unbind before glutamate can unbind.[1] Researchers also evaluated the mechanism of inhibition of GluN1/GluN2C expressed in HEK cells preincubated with glycine for inhibitor 2i (DQP-997-74) by comparing inhibitor potency during the peak and steady-state current responses to glutamate application. The IC50 for compound 2i on GluN1/GluN2C receptors was higher during the peak current responses (IC50 5.0 μM, 95% confidence interval 1.4–8.5 μM) compared to steady-state responses (IC50 0.25 μM, 95% confidence interval 0.15–0.35 μM; F(1, 50) = 81.34, p < 0.0001; see Figure S2), suggesting increased affinity for 2i at glutamate-bound GluN1/GluN2C receptors compared to NMDARs without glutamate bound. The exponential time course of the current response was correlated with compound 2i concentration (R2 = 0.79), and linear regression analysis yielded values of 8.0 × 10⁵ M–1 s–1 for kON and 0.27 s–1 for kOFF (Figure 4D), suggesting a KD value of 0.33 μM. The deactivation of GluN1/GluN2C receptors (0.53 ± 0.07 s) was slowed by the presence of compound 2i when applied at concentrations of 1 μM (1.3 ± 0.14 s; p = 0.001) and 3 μM (2.3 ± 0.40 s; p < 0.0001) but not at 0.1 μM (0.61 ± 0.07 s; p = 0.965) and 0.3 μM (0.88 ± 0.13 s; p = 0.115; Figure S2). [1] In addition, Researchers evaluated how glutamate dependence affects inhibition of responses to brief agonist applications similar to phasic glutamate release that occurs at synapses. To do so, we preincubated cells expressing GluN1/GluN2D receptors with the inhibitor 2i and then applied trains of five brief pulses of NMDA (which dissociates more rapidly than glutamate) and glycine from a pressurized micropipette to mimic repetitive synaptic transmission (Figure 4F). We measured the peak amplitude and compared the concentration–response curves for the inhibition of the first and last response (Figure 4G). The initial train of pulses in the absence of drug controls for systematic errors such as internalization of receptors. During trains of brief agonist applications, the IC50 of compound 2i was 1.9-fold higher at the first pulse (IC50 = 0.75 μM) compared to the fifth pulse (IC50 = 0.40 μM; Figure 4F,G), which suggests that inhibition may be greater during prolonged or repetitive receptor activation. [1] To further evaluate whether 2i followed the law of mass action, Researchers coapplied different concentrations of 2i with glutamate during the steady-state glutamate and glycine responses of GluN1/GluN2D receptors expressed in HEK cells (Figure 4H). We measured the steady-state inhibition produced by each concentration of 2i tested and determined that the IC50 for compound 2i under these conditions was 0.10 μM (Figure 4I, Hill slope 0.93), similar to that found at the steady state during preapplication (Figure 4B). We also fitted the onset and offset time course of the inhibition produced by compound 2i with a single exponential function (Figure 4J). The exponential time course of the current response was correlated with compound 2i concentration (R2 = 0.51), and linear regression analysis yielded values of 2.1 × 10⁵ M–1 s–1 for kON and 0.05 s–1 for kOFF, suggesting a KD value of 0.24 μM. The time course of recovery from 2i inhibition was independent of concentration as expected for drug binding to a single site and suggests that inhibition by 2i does not involve enhanced desensitization. |
| ln Vivo |
Assessment of DQP 2i/DQP-997-74 against Seizures in Tsc1± Mice [1] The acute effects of 2i/DQP-997-74 on in vivo epileptic seizures in male Tsc1± mice were investigated after IP administration at three different doses (7, 14, and 28 mg/kg) during electroencephalogram (EEG) recordings. Tsc1± mice appear to have upregulated expression of GluN2C.41 Administration of 2i at 14 mg/kg significantly reduced spontaneous electrographic seizures in neocortical layers 2/3 and 4 (Figure 6A). In a group of four mice tested at this 2i dose, the seizures were completely stopped in two mice after injection, while the remaining mice were seizure-free after ∼70 min. Furthermore, upon increasing the dose to 28 mg/kg, epileptic events stopped immediately with considerable declines in seizure frequency, duration, and amplitude compared to those of control subjects (Figure 6B,C). In a group of five Tsc1± mice, the 28 mg/kg dose of 2i completely stopped seizure events in four subjects, while the last mouse demonstrated observable seizure reductions after ∼50 min. This in vivo antiseizure activity illustrates the therapeutic potential of compounds within this class for GluN2C/D-associated epilepsy. In Vivo Evaluation of Prodrugs [1] We next considered whether a prodrug strategy could improve brain/plasma ratios of compound 2i/DQP-997-74 by comparing brain and plasma 2i concentrations following the IV administration of prodrugs or parent compound 2i. Although ester prodrugs had low stability in in vitro assays, we tested whether pharmacokinetic profiling of prodrugs 2l, 2m, 2o, and 2p could serve as a proof of concept for future prodrug development. Peak plasma and brain concentrations at 15 min for the parent compound 2i-administered IV were 642 and 14 ng/mL, which were rapidly reduced. Plasma levels of 2i dropped by ∼10-fold at 1 h, with brain levels BLQ at 3 h (Figure 5B). Several prodrugs increased the parent compound 2i concentration and residence time within the brain (Figure 7). Prodrugs showed peak plasma and brain levels of 1190/119 ng/mL (compound 2l), 786/64 ng/mL (compound 2m), 563/26 ng/mL (compound 2o), and 647/56 ng/mL (compound 2p). All prodrugs showed higher 2i brain levels following IV administration compared with brain levels following IV administration of parent 2i alone. At 1 h postadministration, 2i brain levels were 5–10-fold higher for prodrugs than parent 2i alone. At 3 h, brain levels of 2i-administered IV were not detectable, whereas three of the prodrugs had a reasonable brain/plasma ratio at 3 h, with Kp values of 1.36 (2l), 0.36 (2m), and 0.64 (2p), suggesting that prodrugs are capable of higher exposures than 2i and for a longer duration. The increase in the 2i brain/plasma ratio was due to the increased amount of 2i in the brain and longer residence in the brain following IV administration compared to parent 2i (Figure 7). Although the brain exposure still remains low following the addition of the two fluorines and an ester to 2a and micromolar concentrations of these prodrugs produced some inhibition of CYP3A4 (Table 5) or underwent rapid metabolism, these data nevertheless demonstrate that a prodrug approach can enhance brain concentrations. If prodrug groups could be designed that were more stable in plasma and liver microsomes and had improved blood–brain barrier penetration compared to the simple esters explored here, the prodrug strategy might provide more robust tool compounds and a potential clinical lead series. |
| Enzyme Assay |
Liver Microsome Stability [1] Human liver microsomes (HLMs, 20 mg/mL) and CD-1 mouse liver microsomes (MLMs, 20 mg/mL) were prepared in 10 mM stock solutions of distilled H2O. Verapamil and diphenhydramine served as positive controls for HLM and MLM stability, respectively. Test compounds and positive controls were initially dissolved in DMSO to make 10 mM stock solutions. Sample solutions were then further diluted in 70% MeOH/H2O or 100% MeCN to 500 μM. Next, the reactions were prepared by mixing human or mouse liver microsomes (55 μL) with potassium phosphate buffer (100 mM, 928 μL) in 1.5 mL Eppendorf tubes. The test compounds (6.6 μL of 500 μM solution) were subsequently added to the suspensions, and the reaction mixtures were incubated at 37 °C for 5 min. Afterward, the liver microsome reactions were initiated with 110 μL of 10 mM NADPH and further incubated at 37 °C for the designated time course of the study. This procedure provided experiments with a final volume of 1100 μL (<0.6% organic solvent content), a concentration for HLMs and MLMs of 1 mg/mL, and a final test compound concentration of 3 μM. Aliquots (100 μL) were removed from each reaction mixture in duplicate at 0, 5, 10, 15, and 30 min time intervals and quenched with 100 μL of cold internal standard solution (ISTD, 2 μM 7-ethoxy-d5-coumarin in MeOH or MeCN). Quenched aliquots were then centrifuged at 12 500 g for 5–10 min, and the resulting supernatants were withdrawn and placed in LC-MS vials to be analyzed by LC-MS/MS (Agilent G6460C QQQ MS coupled with an Infinity II 1260 HPLC). Each test compound was run in tandem with positive and negative control experiments for quality assurance. Positive control reactions were conducted at a final volume of 550 μL for a single run at each time point. Lastly, the negative control experiment was conducted with test compounds and liver microsomes in the absence of NADPH (150 μL) and analyzed at the 30 min time point. Plasma Stability [1] Human plasma (lithium heparin (LiHep) mixed, gender pooled, 0.2 μm filtered) and mouse plasma (BALB/C, LiHep mixed, male pooled, 0.2 μm filtered) were used. Procaine served as a positive control for both human and mouse plasma experiments. Test compounds and positive controls were initially dissolved in DMSO to make 10 mM stock solutions. The solutions of test and control compounds were then further diluted in 70% MeOH/H2O or 100% MeCN to 500 μM. Next, the human or mouse plasma (994 μL) was aliquoted into 1.5 mL Eppendorf tubes with duplicates (reactions A and B) being prepared for each compound. The plasma was then incubated at 37 °C for 10 min. Afterward, the reaction was initiated by the addition of the test compound (6 μL of 500 μM solution) and further incubated at 37 °C for the designated time course of the study. This procedure provided duplicate experiments with a final volume of 1000 μL (<0.6% organic solvent content) and a final test compound concentration of 3 μM. Aliquots (100 μL) were removed from each reaction mixture at 0, 15, 30, 60, and 120 min time intervals and quenched with 150 μL of cold ISTD solution (2 μM 7-ethoxy-d5-coumarin in MeOH or MeCN). Quenched aliquots were then centrifuged at 15,000 g for 30–45 min, and the resulting supernatants (∼70 μL) were withdrawn and placed in LC-MS vials to be analyzed by LC-MS/MS (Agilent G6460C QQQ MS coupled with an Infinity II 1260 HPLC). Each test compound was run in tandem with positive and negative control experiments for quality assurance. The positive control reaction was conducted at a final volume of 1000 μL for a single run at each time point. Finally, the negative control experiment was conducted with test compounds in DPBS (143 μL) and analyzed at the 120 min time point. Analysis of Off-target Actions [1] Compound (S)-(-)-2i was tested at 1 M for actions at glycine-activated GluN1/GluN3A (human GluN1-F484A,T518L/GluN3A referred to a GluN1-FA,TL/GluN3A) and rat GluN1-4a/GluN3B in the presence of 0.5 M CGP-78608. cRNA injection ratios for GluN1/GluN3 were 1:2. Compound (S)-(-)- 2i was also tested for actions at AMPA (rat GluA1, rat GluA2, human GluA3-L531Y), kainate (rat GluK2), nicotinic acetylcholine (rat 7 and 42, cRNA ratio 1:1), GABAA (rat S, cRNA ratio 1:1:1), GABAC (rat 1), glycine (rat 1), and purinergic (human P2X) receptors expressed in Xenopus oocytes. cRNA encoding the receptor subunits was synthesized from linear template cDNA using the mMessage mMachine kit. Oocytes were injected with 1-5 ng cRNA in a 50 nL volume and incubated in Barth's solution at 15°C for 2-5 days prior to recording. GluK2-expressing oocyte were incubated in 1 mg/ml (10 M) concanavalin-A for 10 min prior to recording. The cDNAs encoding GABAC and glycine subunits were provided by Dr. D. Weiss. cDNAs encoding nicotinic acetylcholine receptor subunits were provided by Drs. R. Papke nd S. Heinemann. cDNAs encoding the purinergic receptors were provided by Dr. R. Hume. GABAA and GABAC receptors were activated by 100 M GABA. Acetylcholine was used at the indicated concentrations (in μM) to activate the nicotinic acetylcholine receptors: α7 (300). 100 M glycine was used to activate the glycine receptor, 100 M glycine was used to activate GluN1/GluN3 receptors, 100 M glutamate was used to activate AMPA and kainate receptors, and 9 M ATP was used to activate the purinergic receptors. Responses in presence of test compound were expressed as a percent of control. Methods for Metabolic Stability Assays [1] LC-MS/MS analyses were conducted on an Agilent 1260 Infinity II HPLC equipped with an Agilent G6460 triple quadrupole mass spectrometer. Reverse-phase HPLC S10 separation for each compound was achieved with an Agilent InfinityLab Poroshell 120 EC-C18 (2.1 x 50 mm, 2.7 m) or EC-C8 (2.1 x 50 mm, 2.7 m) column maintained at 40 oC. The mobile phase used during analyses consisted of either MeOH-H2O (0.1% FA) or MeCN-H2O (0.1% FA) at a flow rate of 0.5 mL/min. Each method was developed in the presence of the internal standard (ISTD), d5-7-ethoxy coumarin. Precursor and product ion detection was performed with Agilent Jet Stream electrospray positive ionization (ESI+) in multiple reaction monitoring (MRM) mode. All MRM transitions, fragmentor voltages, and collision energies for individual compounds are provided in Supplemental Table S4. Other standard MS conditions were as follows: dwell time of 100 ms; gas flow of 10 L/min; nebulizer pressure of 45 psi; delta EMV of 200 V. Lastly, all acquired data was processed using Agilent 6460 Quantitative Analysis software. Methods for Kinetic Solubility Experiments [1] The test compounds were first dissolved in DMSO to provide stock solutions of either 30 mM or 60 mM. Kinetic solubility experiments were then performed in a 96-well microtiter plate with a final volume of 250 µL per well in rows B-H. Each plate was initially prepared with the addition of 16 μL of DMSO to well A3, 20 μL to well A4, 27 μL to well A5, and 40 μL to all remaining wells in row A (A1 and A6-12). Next, the test compound (30 μL of DMSO stock solution) was directly added to well A2 without further modification. Moreover, the test compound (64 μL of DMSO stock solution) was diluted in well A3 to give a total volume of 80 μL. Further dilutions were then conducted by removing 60 µL from well A3 and adding it to A4, followed by removing 53 µL from well A4 and adding it to A5, followed by removing 40 µL from well A5 and adding it to A6, and sequentially removing 40 µL from the remaining wells up to A12. Well A1 served as a DMSO blank. The sample solutions prepared in row A (2.5 µL from each well) were transferred to the corresponding wells in rows B-H. Dulbecco’s phosphate-buffered saline (DPBS, 1X, no Ca2+ and Mg2+, pH S11 7.1-7.3) was then added to all wells in rows B-H (30 µL each), and the 96-well plate was incubated at 25 oC for 1 min. Next, DPBS (217.5 µL) was added to all wells in rows B-H, and the 96-well plate was once more incubated at 25 oC for 2 h. This procedure provided seven replicate experiments with final concentrations of the test compound (1% DMSO in DPBS) ranging from either 300 to 0.9375 µM or 600 to 1.875 µM in rows B-H, depending on the whether a 30 mM or 60 mM DMSO stock solution was used, respectively (i.e. a 100-fold dilution from sample preparation in row A). After incubation, the plates were analyzed using a NEPHELOstar® microplate reader, and the segmental linear regression data was processed with MARS analysis software. |
| Cell Assay |
Voltage-Clamp Analysis of NMDA Receptors [1] Two-Electrode Voltage-Clamp Recordings [1] Unfertilized Xenopus laevis oocytes were obtained from Ecocyte, or ovaries were purchased from Xenopus 1 (Dexter, MI) and oocytes prepared as previously described.42,47 Two-electrode voltage-clamp recordings were performed on oocytes expressing recombinant rat GluN1/GluN2A, GluN1/GluN2B, GluN1/GluN2C, or GluN1/GluN2D. cDNAs for rat GluN1-1a (referred to as GluN1; NCBI Reference Sequence NM_017010.2), GluN2A (NM_012573.4), GluN2B (NM_012574.1), GluN2C (NM_012575.3), and GluN2D (NM_022797.2) were provided by Dr. S. Heinemann from the Salk Institute, Dr. S. Nakanishi from Kyoto University, and Dr. P. Seeburg from the University of Heidelberg. Oocyte isolation, cRNA synthesis, and cRNA injections were performed as previously described.32,33,47 Briefly, Xenopus laevis oocytes were injected with 5–10 ng of cRNA in RNase-free water with the GluN1:GluN2 ratio ranging from 1:1 to 1:5. Oocytes were incubated at 15–19 °C in Barth’s solution consisting of (in mM) 88 NaCl, 1 KCl, 2.4 NaHCO3, 10 HEPES, 0.82 MgSO4, 0.33 Ca(NO3)2, and 0.41 CaCl2 supplemented with 100 μg/mL gentamycin, 40 μg/mL streptomycin, and 50 μg/mL penicillin. Recordings were performed 2–4 days after injection with extracellular recording solution containing (in mM) 90 NaCl, 1 KCl, 10 HEPES, 0.5 BaCl2, and 0.01 EDTA at pH 7.4 adjusted with NaOH. To prevent a gradual increase in current response over the course of the experiment, some oocytes expressing GluN1/GluN2A were injected with 20–50 nL of 2–50 mM K-BAPTA. Concentration–response curves for test compounds were generated by applying a maximally effective concentration of glutamate (100 μM) and glycine (30 μM), followed by glutamate and glycine with variable concentrations of test compounds up to 30 μM. The test compounds were prepared as 20 mM stock solutions in DMSO and diluted to the final concentration in recording solution. The DMSO content was 0.05–0.5% (v/v). Some low potency compounds (2l, 2o, 2p, and 2r) with μM IC50 values were tested in 2, 5, or 10 mM hydroxypropyl-betacyclodextrin. Methods for off-target analysis are given in the Supporting Information. Whole-Cell Voltage-Clamp Recordings [1] HEK293 cells (HEK, ATCC CRL-1573) were plated on glass coverslips pretreated with 0.1 mg/mL poly-d-lysine and cultured in Dulbecco’s modified Eagle medium (DMEM) plus Glutamax supplemented with 10% fetal bovine serum, 10 U/mL of penicillin, and 10 μg/mL of streptomycin at 37 °C and 5% CO2. The cells were transiently transfected with cDNA encoding rat GluN1, GluN2D, and eGFP at a ratio of 1:1:5 by using the calcium phosphate precipitation method.48 After 24–48 h following the transfection, the cells were perfused with external recording solution that contained (in mM) 3 KCl, 150 NaCl, 0.01 EDTA, 1.0 CaCl2, 10 HEPES, and 22 d-mannitol (the pH was adjusted to 7.4 with NaOH). The patch electrodes (resistance 3–5 MΩ) were prepared from thin-walled glass micropipettes by a dual-stage glass micropipette puller (PC-10) and filled with internal solution containing (in mM) 110 d-gluconate, 110 CsOH, 30 CsCl, 5 HEPES, 4 NaCl, 0.5 CaCl2, 2 MgCl2, 5 BAPTA, 2 NaATP, and 0.3 NaGTP. The pH was adjusted to 7.4 with CsOH; osmolality was adjusted to about 300–305 mOsmol/kg. The whole-cell current responses were evoked by application of maximally effectively concentrations of agonists (100 μM glutamate and 30 μM glycine) at a holding potential of −60 mV and recorded using an Axopatch 200B patch-clamp amplifier. A two-barreled theta-glass micropipette was used for rapid solution exchange controlled by a piezoelectric translator. For some experiments, 500 μM NMDA and 250 μM glycine were briefly applied by pressure application from a patch pipette (tip 3–5 MΩ). The current responses were low pass filtered at 2 kHz 8-pole Bessel filter (−3 dB) and digitized at 20 kHz using Digidata 1440A acquisition system (Molecular Devices) controlled by Clampex 10.3. All patch experiments were performed at room temperature (23 °C). |
| Animal Protocol |
IP Administration [1] A group (n = 15) of fed, male C57BL/6 mice ∼6 to 8 weeks of age was injected IP with 10 mg/kg (1 mg/mL) of drug using 50% PEG400 in water as a vehicle. Samples were collected from the blood and brain at 0.25, 0.5, 1, 2, and 4 h after administration (3 mice per time point) following CO2 anesthesia. Collection from the brain was performed as follows: the mouse is terminally anaesthetized via rising concentration of CO2 and as much blood is removed as possible via cardiac puncture. The cardiac puncture is done by opening the chest cavity to expose the heart, cutting an incision in the right auricle using surgical scissors, and finally injecting a saline solution (∼10 mL) slowly into the left ventricle via a syringe. The mouse is placed head down at a 45° angle to facilitate blood removal. After perfusion, the skull is opened and the brain is removed. The whole brain is washed with saline, dried with surgical gauze, placed in tared tubes, and stored at −75 °C before analysis. For plasma sample preparation at the 0.25–2 h time points, 15 μL of blank solution, 30 μL of plasma sample, and 150 μL were added sequentially for protein precipitation. After centrifugation, 20 μL of the supernatant and 80 μL of collection buffer were combined, and thus, the final compound concentration in plasma (ng/mL) was corrected by multiplying by 5. For plasma sample preparation at the 4 h time point, 15 μL of blank solution, 30 μL of plasma sample, and 150 μL of acetonitrile were added sequentially for protein precipitation. For all brain sample preparation, 15 μL of blank solution, 30 μL of brain samples, and 150 μL of acetonitrile were added sequentially for protein precipitation. Brain samples were prepared by adding brain (g) to deionized water (mL) in a 1:4 ratio for homogenization. The mixtures were then vortexed for 30 s and subsequently centrifuged (∼4000 rpm) for 15 min. The supernatant was diluted 3-fold with water, and a 2 μL aliquot of the diluted supernatant was injected into a Shimadzu LC-30A LC-MS/MS system with a Phenomenex 2.6 μ PFP 100A column (30 mm × 2.1 mm) using verapamil as an internal standard. A gradient from 95% water (0.1% formic acid) to 95% ACN (0.1% formic acid) was run over 2 min at a flow rate of 0.6 mL/min. Brain and blood samples were collected at 15, 30, 60, 120, and 240 min from three C57Bl/6 mice at each time point. See Tables S6–S10 for 2i/DQP-997-74 concentrations. IV Administration [1] Nine male C57BL/6 mice were administered intravenously (IV) with solution formulation of prodrug at 5 mg/kg dose (5 mL/kg) in 5% N-methyl-2-pyrrolidine, 5% Solutol HS-15, and 90% saline. Blood samples (∼60 μL) were collected under light isoflurane anesthesia from a set of three mice at 0.25, 1, and 3 h. Plasma was harvested by centrifugation of blood and stored at −70 ± 10 °C until analysis. Immediately after the collection of blood, brain samples were collected from each mouse at respective time points. Brain samples were homogenized using ice-cold phosphate-buffered saline (pH 7.4), and homogenates were stored below −70 ± 10 °C until analysis. The total homogenate volume was 3 times that of the brain weight. The plasma and brain concentration–time data of compounds 2i/DQP-997-74 were used for the pharmacokinetic analysis. Plasma and brain samples were quantified by the fit-for-purpose LC-MS/MS method (LLOQ: 2.06 ng/mL for plasma and 5.16 ng/mL for brain). Tables S11 and S12 show the 2i/DQP-997-74 concentrations. Acute Epileptic Mouse Model [1] All experiments were conducted in agreement with the requirements of the European Directive 2010/63/EU. Mice were housed in ventilated, light-tight, sound-isolated chambers under a standard 12:12 light/dark cycle (light on at 07.00 PM and light off at 07.00 AM) with food and water available ad libitum. C57BL/6J wild-type (Tsc1+/+) females from Janvier Laboratories (France) were crossed with heterozygote Tsc1± male mice with the genetic background B6;129S4-Tsc1tm1.1Djk/Nci. The genotyping of pups issuing from this cross-breeding was performed on tail tissue samples at postnatal day P9. The study was conducted in Tsc1± male mice at P14–16. Pups from at least three deliveries for each condition were studied to minimize the potential sampling bias. The DQP derivative 2i/DQP-997-74 was diluted in DMSO at a concentration of 100 mM before being added to 100 to 150 μL of saline solution and intraperitoneally injected in mice. Intraperitoneal injection was administered during the EEG recordings at three different concentrations: 7, 14, and 28 mg/kg to estimate the dose–response relationship. Experiments were performed on postnatal days of P14 and P16 male Tsc1± mice. Surgery was performed under isoflurane anesthesia and lidocaine analgesia. During recordings, the head was fixed to the frame of a stereotaxic apparatus by attached bars; animals were surrounded by a cotton nest and heated via a thermal pad (36.6–37.7 °C). A silver chloride reference electrode was placed in the cerebellum. EEG recordings were performed with nonanaesthetized head-restrained Tsc1± mice. A 16 site linear silicon probe (100 μm separation distance between recording sites) was placed into the somatosensory cortex using the Paxinos and Franklin atlas (2001)54 at coordinates anterior–posterior = 2–2.5 mm, mediolateral = 2–3 mm from Bregma, 1.2–1.5 mm from the dural surface, in order to trace the columnar activity at all layers. Signals were amplified (×100) and filtered at 3 kHz using a 16-channel amplifier, digitized at 10 kHz, and then saved to the hard disk of a PC using Axoscope software (Molecular Devices). Recordings were analyzed offline using Clampfit and Origin software. After recording, the position of the silicone probe was verified visually by DiI staining of the electrode in 100 μm coronal sections from the fixed brain. We considered that multiunit activity occurred in epileptic discharges if they appeared in a group of multiple spikes whose amplitude exceeded the background activity within a period lasting for at least 20 s. During EEG recordings, animals were monitored visually to determine the behavioral correlates of each electrographic epileptic discharge. During the experiment, EEG recordings were performed for 2 h prior to drug administration, after which drug was intraperitoneally injected with dosages of 7, 14, or 28 mg/kg to investigate its acute effects on in vivo epileptic seizures. EEG recordings then were performed for 2–2.5 h post injection. |
| ADME/Pharmacokinetics |
In Vivo Pharmacokinetic Evaluation of 2i/DQP-997-74 and 2k [1] In order to determine whether 2i (DQP-997-74) and the uncharged amide analogue 2k could be used to probe GluN2C and GluN2D actions in vivo, we performed a mouse pharmacokinetic study and measured the exposure of 2i in plasma and brain tissue (Figure 5). The concentration of 2i observed in the brain remained low with a Cmax of only 23 ng/g after a 10 mg/kg intraperitoneal (IP) injection. When injected intravenously (IV) 2i exhibited even lower Cmax within the brain (14 ng/g at 15 min) and plasma (642 ng/mL at 15 min) that rapidly diminished over time. However, 2i plasma and brain concentrations of 2i remained relatively stable for at least 2 h following IP administration. Compound 2k replaces the carboxylate with an amide, which will be uncharged at physiological pH. Compound 2k showed a similar profile, with modestly lower plasma and brain levels (Table 3), which indicated that removal of the charged carboxylate did not improve the brain permeability. Although mouse brain Cmax levels for 2i were low following IP administration, they were maintained over the course of 4 h, and the compound could reach brain concentrations (40 nM in brain compartment, upper limit of 200 nM if 2i is restricted to extracellular space) that might provide some NMDAR antagonism (GluN2D IC50 130 nM), although the free fraction of 2i in brain (<0.1%) was not improved compared to 2a (Table S2). In Vitro DMPK Profiles for DQP Prodrugs [1] Anticipating that the carboxylate side chain may hinder BBB penetrance, we synthesized and biologically screened a series of 2i/DQP-997-74 prodrugs with ester and amide masking groups. With the classical physiochemical parameters required for brain exposure (i.e., molecular weight, MW, lipophilicity, and topological polar surface area, TPSA) and drug release mechanisms beyond the BBB in mind, we focused on simple alkyl-based promoieties. Our selected lead compound (2i), a close analogue (2a), and their corresponding prodrugs (2l–r) were studied in vitro to ascertain drug solubility, metabolic stability in liver microsomes (LMs), plasma stability, mouse brain homogenate stability, and cytochrome P450 (CYP450) inhibition (Tables S3 and S4 for predicted absorption, distribution, metabolism, and excretion or ADME parameters). We first determined the solubility of compounds 2a, 2i, and 2k–2r in phosphate-buffered saline (PBS, 1% DMSO) at room temperature (Table 4 and Figure S4). Our previous lead 2a demonstrated a relatively high PBS solubility of ∼208 μM. However, we observed a reduction in the solubility of difluoro derivatives 2i (∼38 μM) and 2k (∼30 μM). An accurate solubility comparison via a nephelometer between the active parent species (2i and 2k) and their analogous prodrugs (2l–2r) could not be obtained. However, since all compounds precipitated within the range 25–55 μM, they likely possess aqueous solubility values similar to those of the parent. Compounds 2a and 2i/DQP-997-74 demonstrated high stability (i.e., greater than 95% remaining over the assay time course) in human and mouse LMs and plasma (Table 4 and Figures S5 and S6). Additionally, 2a and 2i either weakly inhibited or displayed no activity against the major drug metabolizing enzymes of CNS clinical relevance, CYP2D6 and CYP3A4 (Table 5 and Figure S4). While amide 2k was stable in both LMs and human plasma, the compound was metabolized in mouse plasma (42% of prodrug after 2 h) and brain homogenate (56% of prodrug after 4 h; Table 4) and moderately inhibited CYP3A4 (IC50 = 2 μM) at concentrations 10-fold higher than the IC50 at GluN1/GluN2D (Table 5). Further metabolite identification experiments are required to elucidate which mouse enzymes degraded 2k. Despite 2k being stable to human and mouse LMs (greater than 90% of parent remaining after 30 min), 2q and 2r decomposed quite rapidly (t1/2 ≤ 7 min; Table 4). Although there is evidence for 2q instability in brain homogenate (33% prodrug remaining after 4 h), 2i, the amidase-catalyzed hydrolysis product, was unobservable and below the limit of quantification (BLQ) by LC-MS/MS (Table 4). Interestingly, 2r was stable under the same conditions (93% prodrug remaining). Since neither the amide moiety produced 2i in brain homogenate nor was stable to hepatic metabolism (presumably from N-demethylation), we did not advance 2q or 2r to in vivo pharmacokinetic studies. [1] All ester prodrugs hydrolyzed to 2i/DQP-997-74 in mouse brain homogenate, with the less sterically hindered promoieties 2l, 2n, and 2p cleaving more efficiently than the bulkier substrates 2m and 2o (Tables 4 and S5). Although stable in human plasma, the ester series also exhibited high metabolic instability in LMs (<5 min) and mouse plasma (<40 min). Additionally, while the ester prodrugs did not inhibit CYP2D6, compounds 2l–o displayed increased CYP3A4 inhibition (6–12 μM) relative to 2i, which suggests the potential for drug–drug interactions (Table 5). |
| References | [1]. D'Erasmo MP, et al. Development of a Dihydroquinoline-Pyrazoline GluN2C/2D-Selective Negative Allosteric Modulator of the N-Methyl-d-aspartate Receptor. ACS Chem Neurosci. 2023 Sep 6;14(17):3059-3076.. |
| Additional Infomation | Subunit-selective inhibition of N-methyl-d-aspartate receptors (NMDARs) is a promising therapeutic strategy for several neurological disorders, including epilepsy, Alzheimer's and Parkinson's disease, depression, and acute brain injury. We previously described the dihydroquinoline-pyrazoline (DQP) analogue 2a (DQP-26) as a potent NMDAR negative allosteric modulator with selectivity for GluN2C/D over GluN2A/B. However, moderate (<100-fold) subunit selectivity, inadequate cell-membrane permeability, and poor brain penetration complicated the use of 2a as an in vivo probe. In an effort to improve selectivity and the pharmacokinetic profile of the series, we performed additional structure-activity relationship studies of the succinate side chain and investigated the use of prodrugs to mask the pendant carboxylic acid. These efforts led to discovery of the analogue (S)-(-)-2i, also referred to as (S)-(-)-DQP-997-74, which exhibits >100- and >300-fold selectivity for GluN2C- and GluN2D-containing NMDARs (IC50 0.069 and 0.035 μM, respectively) compared to GluN2A- and GluN2B-containing receptors (IC50 5.2 and 16 μM, respectively) and has no effects on AMPA, kainate, or GluN1/GluN3 receptors. Compound (S)-(-)-2i is 5-fold more potent than (S)-2a. In addition, compound 2i shows a time-dependent enhancement of inhibitory actions at GluN2C- and GluN2D-containing NMDARs in the presence of the agonist glutamate, which could attenuate hypersynchronous activity driven by high-frequency excitatory synaptic transmission. Consistent with this finding, compound 2i significantly reduced the number of epileptic events in a murine model of tuberous sclerosis complex (TSC)-induced epilepsy that is associated with upregulation of the GluN2C subunit. Thus, 2i represents a robust tool for the GluN2C/D target validation. Esterification of the succinate carboxylate improved brain penetration, suggesting a strategy for therapeutic development of this series for NMDAR-associated neurological conditions.[1] |
Solubility Data
| Solubility (In Vitro) | May dissolve in DMSO (in most cases), if not, try other solvents such as H2O, Ethanol, or DMF with a minute amount of products to avoid loss of samples |
| Solubility (In Vivo) |
Note: Listed below are some common formulations that may be used to formulate products with low water solubility (e.g. < 1 mg/mL), you may test these formulations using a minute amount of products to avoid loss of samples. Injection Formulations (e.g. IP/IV/IM/SC) Injection Formulation 1: DMSO : Tween 80: Saline = 10 : 5 : 85 (i.e. 100 μL DMSO stock solution → 50 μL Tween 80 → 850 μL Saline) *Preparation of saline: Dissolve 0.9 g of sodium chloride in 100 mL ddH ₂ O to obtain a clear solution. Injection Formulation 2: DMSO : PEG300 :Tween 80 : Saline = 10 : 40 : 5 : 45 (i.e. 100 μL DMSO → 400 μLPEG300 → 50 μL Tween 80 → 450 μL Saline) Injection Formulation 3: DMSO : Corn oil = 10 : 90 (i.e. 100 μL DMSO → 900 μL Corn oil) Example: Take the Injection Formulation 3 (DMSO : Corn oil = 10 : 90) as an example, if 1 mL of 2.5 mg/mL working solution is to be prepared, you can take 100 μL 25 mg/mL DMSO stock solution and add to 900 μL corn oil, mix well to obtain a clear or suspension solution (2.5 mg/mL, ready for use in animals). Injection Formulation 4: DMSO : 20% SBE-β-CD in saline = 10 : 90 [i.e. 100 μL DMSO → 900 μL (20% SBE-β-CD in saline)] *Preparation of 20% SBE-β-CD in Saline (4°C,1 week): Dissolve 2 g SBE-β-CD in 10 mL saline to obtain a clear solution. Injection Formulation 5: 2-Hydroxypropyl-β-cyclodextrin : Saline = 50 : 50 (i.e. 500 μL 2-Hydroxypropyl-β-cyclodextrin → 500 μL Saline) Injection Formulation 6: DMSO : PEG300 : castor oil : Saline = 5 : 10 : 20 : 65 (i.e. 50 μL DMSO → 100 μLPEG300 → 200 μL castor oil → 650 μL Saline) Injection Formulation 7: Ethanol : Cremophor : Saline = 10: 10 : 80 (i.e. 100 μL Ethanol → 100 μL Cremophor → 800 μL Saline) Injection Formulation 8: Dissolve in Cremophor/Ethanol (50 : 50), then diluted by Saline Injection Formulation 9: EtOH : Corn oil = 10 : 90 (i.e. 100 μL EtOH → 900 μL Corn oil) Injection Formulation 10: EtOH : PEG300:Tween 80 : Saline = 10 : 40 : 5 : 45 (i.e. 100 μL EtOH → 400 μLPEG300 → 50 μL Tween 80 → 450 μL Saline) Oral Formulations Oral Formulation 1: Suspend in 0.5% CMC Na (carboxymethylcellulose sodium) Oral Formulation 2: Suspend in 0.5% Carboxymethyl cellulose Example: Take the Oral Formulation 1 (Suspend in 0.5% CMC Na) as an example, if 100 mL of 2.5 mg/mL working solution is to be prepared, you can first prepare 0.5% CMC Na solution by measuring 0.5 g CMC Na and dissolve it in 100 mL ddH2O to obtain a clear solution; then add 250 mg of the product to 100 mL 0.5% CMC Na solution, to make the suspension solution (2.5 mg/mL, ready for use in animals). Oral Formulation 3: Dissolved in PEG400 Oral Formulation 4: Suspend in 0.2% Carboxymethyl cellulose Oral Formulation 5: Dissolve in 0.25% Tween 80 and 0.5% Carboxymethyl cellulose Oral Formulation 6: Mixing with food powders Note: Please be aware that the above formulations are for reference only. InvivoChem strongly recommends customers to read literature methods/protocols carefully before determining which formulation you should use for in vivo studies, as different compounds have different solubility properties and have to be formulated differently. (Please use freshly prepared in vivo formulations for optimal results.) |
| Preparing Stock Solutions | 1 mg | 5 mg | 10 mg | |
| 1 mM | 1.7532 mL | 8.7658 mL | 17.5316 mL | |
| 5 mM | 0.3506 mL | 1.7532 mL | 3.5063 mL | |
| 10 mM | 0.1753 mL | 0.8766 mL | 1.7532 mL |