AkaLumine, an open-ring analog of CycLuc1, is a novel luciferin analog and substrate for firefly luciferase. The bioluminescence produced by AkaLumine in reactions with native firefly luciferase is in the near-infrared wavelength ranges (λmax=677 nm), and yields significantly increased target-detection sensitivity from deep tissues with maximal signals attained at very low concentrations, as compared with D-luciferin and emerging synthetic luciferin CycLuc1.
Physicochemical Properties
| Molecular Formula | C16H18N2O2S |
| Molecular Weight | 302.391322612762 |
| Exact Mass | 302.108 |
| Elemental Analysis | C, 63.55; H, 6.00; N, 9.26; O, 10.58; S, 10.60 |
| CAS # | 1176235-08-7 |
| Related CAS # | 1176235-08-7; 2558205-28-8 (HCl) |
| PubChem CID | 139329217 |
| Appearance | Typically exists as solid at room temperature |
| Density | 1.2±0.1 g/cm3 |
| Boiling Point | 541.4±60.0 °C at 760 mmHg |
| Flash Point | 281.2±32.9 °C |
| Vapour Pressure | 0.0±1.5 mmHg at 25°C |
| Index of Refraction | 1.598 |
| LogP | 2.06 |
| Hydrogen Bond Donor Count | 1 |
| Hydrogen Bond Acceptor Count | 5 |
| Rotatable Bond Count | 5 |
| Heavy Atom Count | 21 |
| Complexity | 449 |
| Defined Atom Stereocenter Count | 0 |
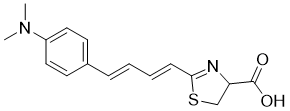
| SMILES | S1C(/C=C/C=C/C2C=CC(=CC=2)N(C)C)=NC(C(=O)O)C1 |
| InChi Key | ULTVSKXCSMDCHR-GGWOSOGESA-N |
| InChi Code | InChI=1S/C16H18N2O2S/c1-18(2)13-9-7-12(8-10-13)5-3-4-6-15-17-14(11-21-15)16(19)20/h3-10,14H,11H2,1-2H3,(H,19,20)/b5-3+,6-4+ |
| Chemical Name | 2-[(1E,3E)-4-[4-(dimethylamino)phenyl]buta-1,3-dienyl]-4,5-dihydro-1,3-thiazole-4-carboxylic acid |
| HS Tariff Code | 2934.99.9001 |
| Storage |
Powder-20°C 3 years 4°C 2 years In solvent -80°C 6 months -20°C 1 month |
| Shipping Condition | Room temperature (This product is stable at ambient temperature for a few days during ordinary shipping and time spent in Customs) |
Biological Activity
| Targets | Recombinant Fluc protein (Km = 2.06 μM ) |
| ln Vitro | The signal in LLC/luc and MDA-MB-231/luc cells treated with AkaLumine HCl peaked at a lower concentration (2.5 μM), while D-luciferin and CycLuc1 produced more bioluminescence at higher doses. rise, even at 250 μM not reaching the maximum signal [1]. |
| ln Vivo |
AkaLumine hydrochloride revealed a considerably elevated signal from lung metastases, with an 8.1-fold augmentation compared to administration of D-luciferin. To evaluate the superiority of AkaLumine HCl over CycLuc1 in detecting deep tissue targets, bioluminescence of AkaLumine HCl and CycLuc1-treated mice 15 min after intravenous injection of LLC/luc cells at a 5 mM dose (maximum dose) Images for comparison The concentration of CycLuc1 is higher due to its low water solubility. Compared with CycLuc1, AkaLumine hydrochloride shows a 3.3-fold boost in detection sensitivity for disseminated lung cancer cells. The superiority of AkaLumine hydrochloride was further validated by imaging the same mice with lung metastases following intraperitoneal injection of 5 mM substrate in the order of CycLuc1 and AkaLumine hydrochloride, and every 8 hours in the reverse order. Imaging. AkaLumine hydrochloride demonstrates an approximately fourfold increase in lung metastatic signal compared to CycLuc1 [1].
Enables highly sensitive deep - tissue imaging in mice. After intraperitoneal injection of AkaLumine into mice, it can react with luciferase, and the generated near - infrared bioluminescence can penetrate tissues, allowing for clear imaging of deep - tissue structures, such as the brain and abdominal organs. This provides a powerful tool for non - invasive monitoring of biological processes in living animals [1] |
| Enzyme Assay |
Measurement of bioluminescence emission spectra [1] Bioluminescence emission spectra of d-luciferin, CycLuc1 and AkaLumine-HCl were measured using an ATTO AB-1850 spectrophotometer. A reaction mixture was prepared by mixing 5 μl of a substrate (100 μM), 5 μl of QuantiLum Recombinant Luciferase solution (1 mg ml−1) and 5 μl of potassium phosphate buffer (500 mM, pH 8.0). Luminescence reactions were then initiated by injecting 10 μl of ATP-Mg (200 μM) into the reaction mixture. Bioluminescence emission spectra were measured in 1 nm increments from 400 to 780 nm using 3 min of integration time.[1] Measurement of K m value[1] The bioluminescence intensities of d-luciferin, CycLuc1 and AkaLumine-HCl were measured in same conditions with measurement of bioluminescence spectrum, except substrate concentration. Final concentrations of the substrates were varied from 0.2 to 500 μM and 0.1 to 100 μM, respectively. Km and Vmax values of the substrates were determined from the integrated value of the bioluminescence intensity and calculated by the Lineweaver–Burk plots by using the Enzyme Kinetics Wizard in the commercially available SigmaPlot 9.0 software package. |
| Cell Assay |
Bioluminescence transmission assay using biological tissues[1] Bioluminescence signal from wells was measured with IVIS Spectrum 1 min after the substrate (final concentration of 2.5 μM for d-lucfierin and AkaLumine-HCl, 50 nM for CycLuc1) was reacted with recombinant Fluc proteins (20 μg ml−1) in the presence of ATP-Mg (final concentration of 20 μM) in a black 96-well plate. A biological tissue (4-mm-thick sliced beef) was placed on the wells, to measure bioluminescence signal through the tissue, followed by acquiring bioluminescence images through two layers of the biological tissue. The following conditions were used for image acquisition: exposure time=10 s, binning=medium: 8, field of view=12.9 × 12.9 cm, and f/stop=1. The bioluminescence images were analysed by Living Image 4.3 software (PerkinElmer) specialized for IVIS system. Penetration efficiency (%) was calculated by dividing the signal intensities of the beef-covered wells by those of the corresponding uncovered wells.[1] Isolation of cancer cell lines stably expressing luc reporters[1] The murine lung carcinoma cell LLC, human breast cancer cell MDA-MB-231 and human prostate cancer cell PC-3 were obtained from ATCC. LLC/luc and MDA-MB-231/luc cells were isolated after transfection with plasmid pEF/luc by calcium phosphate method as previously described19,20. PC-3/κB-luc was also isolated as previously described21. The cells were maintained at 37 °C in 5% FCS-DMEM (Nacalai Tesque, Kyoto, Japan) supplemented with penicillin (100 units per ml) and streptomycin (100 μg ml−1) and regularly checked for mycoplasma contamination by a mycoplasma check kit. All the cell lines were independently stored and recovered from the original stock every time for each experiment.[1] In vitro BLI[1] The substrates were reacted with LLC/luc or MDA-MB-231/luc cells (4 × 10⁵ cells per well) in a black 96-well plate. Bioluminescence was measured using IVIS Spectrum 1 min after adding the substrates. The following conditions were used for image acquisition: open for total bioluminescence or 680±10 nm of an emission filter for NIR bioluminescence, exposure time=10 s, binning=medium: 8, field of view=12.9 × 12.9 cm and f/stop=1. The bioluminescence images were analysed by Living Image 4.3 software specialized for IVIS system. |
| Animal Protocol |
Tumour models For subcutaneous tumour models, LLC/luc (3 × 10⁵ cells per 10 μl) or PC-3/κB-luc (1 × 10⁶ cells per 10 μl) suspended in PBS was mixed with an equal volume of Geltrex and subcutaneously or intratibially injected into C57B/6 albino mice (female) or severe combined immunodeficient mice (male), respectively. The experiments were performed 4 days after engraftment. For a model with disseminated cancer cells in the lung, C57B/6 albino mice (male) were intravenously injected with LLC/luc (1 × 10⁵ cells per 100 μl PBS) 15 min before in vivo BLI. For lung metastasis model, LLC/luc (5 × 10⁵ cells per 100 μl) suspended in PBS was injected from tail vein of C57B/6 albino mice (male). The experiments were performed 10–20 days after intravenous injection. These tumour models are well established and tumour growth is stable. Therefore, six samples are adequate sample size for evaluation of tumour growth in each experiment. In vivo BLI Bioluminescence images of subcutaneous tumours were acquired with IVIS Spectrum 15 min (unless otherwise indicated) after intraperitoneal injection with indicated amount of the substrates. As bioluminescence intensities from lung metastasis peaked at various time after a substrate injection, bioluminescence images of lung metastasis were sequentially acquired with IVIS Spectrum every 3 min for 30 min after intraperitoneal injection with the substrates and the highest bioluminescence intensities among the acquired images were selected for analysis. For comparing bioluminescence production between different substrates using the same mice, the images for AkaLumine-HCl were acquired 4 and 8 h after injection of d-luciferin and CycLucl, respectively. The following conditions were used for image acquisition: open emission filter, exposure time=60 s, binning=medium: 8, field of view=12.9 × 12.9 cm and f/stop=1. For three-dimensional BLI in lung metastasis model, a mouse injected with AkaLumine-HCl was subjected to BLI with three different wavelengths (660±10, 680±10 and 700±10 nm) of bioluminescence filters. The following conditions were used for imaging acquisition: exposure time=60 s, binning=medium: 8, field of view=12.9 × 12.9 cm and f/stop=1. The bioluminescence images were analysed by Living Image 4.3 software specialized for IVIS system. Ex vivo BLI A mouse was scarified immediately after in vivo BLI by using AkaLumine-HCl and the lung was removed. Bioluminescence image of the lung was obtained with the following conditions: open emission filter, exposure time=30 s, binning=medium: 8, field of view=12.9 × 12.9 cm and f/stop=1. The bioluminescence images were analysed by Living Image 4.3 software specialized for IVIS system. Dissolve AkaLumine in dimethyl sulfoxide (DMSO) first, and then dilute it with physiological saline. Intraperitoneally inject the prepared solution into mice at a dose of 10 mg/kg. Observe the bioluminescence signal of mice with an in - vivo imaging system at different time points after injection to perform deep - tissue imaging [1] |
| Toxicity/Toxicokinetics |
No obvious toxic effects were observed in mice after intraperitoneal injection of AkaLumine. There was no significant change in the general condition of mice, and no damage to liver and kidney functions was found, indicating that AkaLumine has good biocompatibility and low toxicity [1] |
| References |
[1]. A luciferin analogue generating near-infrared bioluminescence achieves highly sensitive deep-tissue imaging. Nat Commun. 2016 Jun 14;7:11856. |
| Additional Infomation |
AkaLumine is a luciferin analogue. Traditional luciferin - luciferase systems have limitations in in - vivo signal detection due to the short - wavelength light that is easily absorbed by tissues. AkaLumine can generate near - infrared bioluminescence, which has better tissue penetration, enabling highly sensitive deep - tissue imaging. It can be used for non - invasive monitoring of gene expression and biological processes in living animals, providing a new method for biological research and pre - clinical research [1] |
Solubility Data
| Solubility (In Vitro) | May dissolve in DMSO (in most cases), if not, try other solvents such as H2O, Ethanol, or DMF with a minute amount of products to avoid loss of samples |
| Solubility (In Vivo) |
Note: Listed below are some common formulations that may be used to formulate products with low water solubility (e.g. < 1 mg/mL), you may test these formulations using a minute amount of products to avoid loss of samples. Injection Formulations (e.g. IP/IV/IM/SC) Injection Formulation 1: DMSO : Tween 80: Saline = 10 : 5 : 85 (i.e. 100 μL DMSO stock solution → 50 μL Tween 80 → 850 μL Saline) *Preparation of saline: Dissolve 0.9 g of sodium chloride in 100 mL ddH ₂ O to obtain a clear solution. Injection Formulation 2: DMSO : PEG300 :Tween 80 : Saline = 10 : 40 : 5 : 45 (i.e. 100 μL DMSO → 400 μLPEG300 → 50 μL Tween 80 → 450 μL Saline) Injection Formulation 3: DMSO : Corn oil = 10 : 90 (i.e. 100 μL DMSO → 900 μL Corn oil) Example: Take the Injection Formulation 3 (DMSO : Corn oil = 10 : 90) as an example, if 1 mL of 2.5 mg/mL working solution is to be prepared, you can take 100 μL 25 mg/mL DMSO stock solution and add to 900 μL corn oil, mix well to obtain a clear or suspension solution (2.5 mg/mL, ready for use in animals). Injection Formulation 4: DMSO : 20% SBE-β-CD in saline = 10 : 90 [i.e. 100 μL DMSO → 900 μL (20% SBE-β-CD in saline)] *Preparation of 20% SBE-β-CD in Saline (4°C,1 week): Dissolve 2 g SBE-β-CD in 10 mL saline to obtain a clear solution. Injection Formulation 5: 2-Hydroxypropyl-β-cyclodextrin : Saline = 50 : 50 (i.e. 500 μL 2-Hydroxypropyl-β-cyclodextrin → 500 μL Saline) Injection Formulation 6: DMSO : PEG300 : castor oil : Saline = 5 : 10 : 20 : 65 (i.e. 50 μL DMSO → 100 μLPEG300 → 200 μL castor oil → 650 μL Saline) Injection Formulation 7: Ethanol : Cremophor : Saline = 10: 10 : 80 (i.e. 100 μL Ethanol → 100 μL Cremophor → 800 μL Saline) Injection Formulation 8: Dissolve in Cremophor/Ethanol (50 : 50), then diluted by Saline Injection Formulation 9: EtOH : Corn oil = 10 : 90 (i.e. 100 μL EtOH → 900 μL Corn oil) Injection Formulation 10: EtOH : PEG300:Tween 80 : Saline = 10 : 40 : 5 : 45 (i.e. 100 μL EtOH → 400 μLPEG300 → 50 μL Tween 80 → 450 μL Saline) Oral Formulations Oral Formulation 1: Suspend in 0.5% CMC Na (carboxymethylcellulose sodium) Oral Formulation 2: Suspend in 0.5% Carboxymethyl cellulose Example: Take the Oral Formulation 1 (Suspend in 0.5% CMC Na) as an example, if 100 mL of 2.5 mg/mL working solution is to be prepared, you can first prepare 0.5% CMC Na solution by measuring 0.5 g CMC Na and dissolve it in 100 mL ddH2O to obtain a clear solution; then add 250 mg of the product to 100 mL 0.5% CMC Na solution, to make the suspension solution (2.5 mg/mL, ready for use in animals). Oral Formulation 3: Dissolved in PEG400 Oral Formulation 4: Suspend in 0.2% Carboxymethyl cellulose Oral Formulation 5: Dissolve in 0.25% Tween 80 and 0.5% Carboxymethyl cellulose Oral Formulation 6: Mixing with food powders Note: Please be aware that the above formulations are for reference only. InvivoChem strongly recommends customers to read literature methods/protocols carefully before determining which formulation you should use for in vivo studies, as different compounds have different solubility properties and have to be formulated differently. (Please use freshly prepared in vivo formulations for optimal results.) |
| Preparing Stock Solutions | 1 mg | 5 mg | 10 mg | |
| 1 mM | 3.3070 mL | 16.5349 mL | 33.0699 mL | |
| 5 mM | 0.6614 mL | 3.3070 mL | 6.6140 mL | |
| 10 mM | 0.3307 mL | 1.6535 mL | 3.3070 mL |