Physicochemical Properties
| Molecular Formula | C11H15N5O4 |
| Molecular Weight | 281.2679 |
| Exact Mass | 281.112 |
| CAS # | 15763-06-1 |
| PubChem CID | 27476 |
| Appearance | White to off-white solid powder |
| Density | 1.9±0.1 g/cm3 |
| Boiling Point | 655.4±65.0 °C at 760 mmHg |
| Flash Point | 350.2±34.3 °C |
| Vapour Pressure | 0.0±2.1 mmHg at 25°C |
| Index of Refraction | 1.824 |
| LogP | -3.27 |
| Hydrogen Bond Donor Count | 4 |
| Hydrogen Bond Acceptor Count | 7 |
| Rotatable Bond Count | 2 |
| Heavy Atom Count | 20 |
| Complexity | 433 |
| Defined Atom Stereocenter Count | 4 |
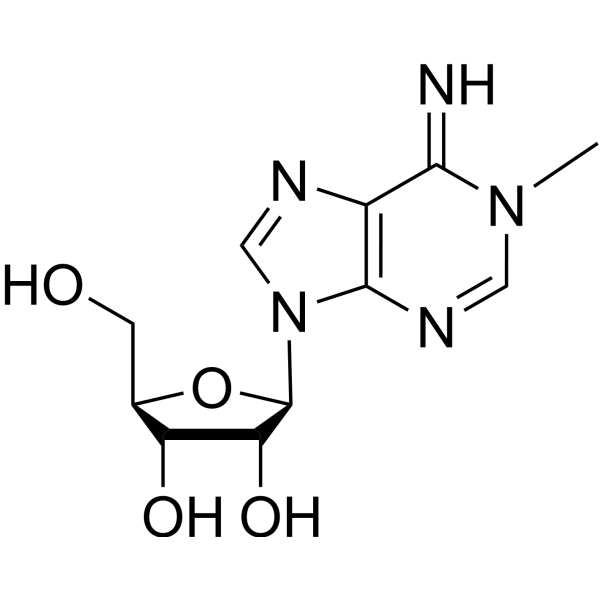
| SMILES | CN1C=NC2=C(C1=N)N=CN2[C@H]3[C@@H]([C@@H]([C@H](O3)CO)O)O |
| InChi Key | GFYLSDSUCHVORB-IOSLPCCCSA-N |
| InChi Code | InChI=1S/C11H15N5O4/c1-15-3-14-10-6(9(15)12)13-4-16(10)11-8(19)7(18)5(2-17)20-11/h3-5,7-8,11-12,17-19H,2H2,1H3/t5-,7-,8-,11-/m1/s1 |
| Chemical Name | (2R,3S,4R,5R)-2-(hydroxymethyl)-5-(6-imino-1-methylpurin-9-yl)oxolane-3,4-diol |
| Synonyms | 1-Methyladenosine; 15763-06-1; N1-Methyladenosine; Adenosine, 1-methyl-; CHEBI:16020; N1-Methyl-D-adenosine; (2R,3S,4R,5R)-2-(hydroxymethyl)-5-(6-imino-1-methylpurin-9-yl)oxolane-3,4-diol; Adenosine, N,6-didehydro-1,6-dihydro-1-methyl-; |
| HS Tariff Code | 2934.99.9001 |
| Storage |
Powder-20°C 3 years 4°C 2 years In solvent -80°C 6 months -20°C 1 month |
| Shipping Condition | Room temperature (This product is stable at ambient temperature for a few days during ordinary shipping and time spent in Customs) |
Biological Activity
| Targets | Endogenous Metabolite |
| ln Vitro | The combination of Reverse Transcription (RT) and high-throughput sequencing has emerged as a powerful combination to detect modified nucleotides in RNA via analysis of either abortive RT-products or of the incorporation of mismatched dNTPs into cDNA. Here we simultaneously analyze both parameters in detail with respect to the occurrence of N-1-methyladenosine (m1A) in the template RNA. This naturally occurring modification is associated with structural effects, but it is also known as a mediator of antibiotic resistance in ribosomal RNA. In structural probing experiments with dimethylsulfate, m1A is routinely detected by RT-arrest. A specifically developed RNA-Seq protocol was tailored to the simultaneous analysis of RT-arrest and misincorporation patterns. By application to a variety of native and synthetic RNA preparations, we found a characteristic signature of m1A, which, in addition to an arrest rate, features misincorporation as a significant component. Detailed analysis suggests that the signature depends on RNA structure and on the nature of the nucleotide 3′ of m1A in the template RNA, meaning it is sequence dependent. The RT-signature of m1A was used for inspection and confirmation of suspected modification sites and resulted in the identification of hitherto unknown m1A residues in trypanosomal tRNA [1]. |
| Enzyme Assay |
Sample preparation [1] Prior to LC-MS/MS analysis, RNA samples were digested into nucleosides according to the following protocol: samples were incubated in presence of 1/10 volume of 10× nuclease P1 buffer (0.2 M ammonium acetate pH 5.0, ZnCl2 0.2 mM), 0.3 U nuclease P1 and 0.1 U snake venom phosphodiesterase at 37°C for 2 h. Next, 1/10 volume of 10× fast alkaline phosphatase buffer and 1 U fast alkaline phosphatase were added, and samples were incubated for additional 60 min at 37°C. After digestion, 1/10 volume of 13C-labeled total RNA (S. cerevisiae, 10 ng/μl), prepared as described, was added as internal standard for N-1-methyladenosine (m1A) quantification. MS parameters [1] Prior to entering the mass spectrometer, the effluent from the column was measured photometrically at 254 nm by the DAD. The triple quadruple mass spectrometer, equipped with an electrospray ion source, was run at the following ESI parameters: gas (N2) temperature 350°C, gas (N2) flow 8 l/min, nebulizer pressure 50 psi, sheath gas (N2) temperature 350°C, sheath gas (N2) flow 12 l/min and capillary voltage 3000 V. The MS was operated in the positive ion mode using Agilent MassHunter software. For the detection and quantification of N-1-methyladenosine (m1A), time-segmented multiple reaction monitoring (MRM mode) was applied in order to ensure the separation of m1A from other methylated adenosine derivatives. The elution of N-1-methyladenosine (m1A) took place in the time segment from 5 to 8.5 min, while e.g. m6A could be detected in the last segment starting at 14 min, thus the segmentation allowed the exclusive detection of m1A. Mass transitions and QQQ parameters used can be found in Table 1. Peak areas were determined employing Agilent MassHunter Qualitative Analysis Software. In the case of adenosine, peak areas were extracted from the recorded UV chromatograms in order to avoid saturation of the mass signals. N-1-methyladenosine (m1A) and A quantification [1] In order to quantify the N-1-methyladenosine (m1A) content of the RNA samples, 13C-labeled total RNA from S. cerevisiae was used as a stable isotope-labeled internal standard (SIL-IS) as described for total RNA from Escherichia coli previously. Briefly, 10 calibration solutions containing 0.01–500 fmol/μl N-1-methyladenosine (m1A) and 10 ng/μl SIL-IS were prepared and analyzed by LC-MS/MS (injection volume 10 μl/sample). For determination of a nucleoside–isotope response factor for m1A, the ratio of the extracted areas of the 12C-m1A and 13C-m1A peaks was calculated for each calibration solution. The resulting response factor was then used for m1A quantification in the RNA samples. Quantification of A was performed by running an external calibration series (5–1000 pmol) and extracting the peak areas from the recorded UV chromatogram. For inter-sample comparability, the detected m1A amount was normalized to the A content for each sample (% m1A/A). For the synthetic RNA samples with defined sequence, the quantification of A enables the calculation of the analyzed amount of RNA as well as the percentage of RNA molecules carrying an m1A modification. Results are displayed in Supplementary Table S7. |
| Cell Assay |
Signature extraction [1] Mapping was followed by format conversion using SAMtools. From SAM files, sorted and indexed BAM files were generated, which were translated to Pileup format. An additional conversion lead to a custom tab-separated text file format, termed Profile (details in Supplementary Table S3), providing all parameters of relevance for inspection of modification candidates. Herein, for each reference position the listed properties include coverage c, arrest rate a, mismatch content m as well as the counts for each base type. All presented RT signatures were compiled manually during visual inspection of the mapping results. Database entries of N-1-methyladenosine (m1A) sites listed in MODOMICS were retrieved and confirmed by evaluation of arrest rate characteristics and mismatch patterns. The extracted signatures were complemented by those of m1As from homologous identification performed via ClustalW2 sequence alignments of related organisms. Identification was performed by isolated visual inspection. By manual selection, positional shifts of m1A58 to e.g. positions 57 or 59 due to variable loops were correctly recognized and from all sites listed in Modomics, those could be determined that obtained a signature projected by our approach. Supervised prediction [1] The uniqueness of N-1-methyladenosine (m1A)'s RT signature was evaluated by supervised prediction, i.e. machine learning mediated detection of known m1A instances within a pool of non-methylated adenosine sites with N-1-methyladenosine (m1A)-resembling or differing sequencing profiles. The general workflow is shown in Supplementary Figure S6. Mean prediction performances (sensitivity, specificity) were calculated from 10 repetitions of a five-fold stratified cross-validation, training and testing a Random Forest (RF) R package implementation (21). The training sets contained equal amounts of instances of both classes. Attributes used for classification input were its arrest rate a, relative mismatch content m, relative mismatch composition values (G, T and C content), m/a and the fold change of a w.r.t. the mean a within the site's −5 and +5 bp neighborhood, termed context sensitive arrest rate (CSA). The input format of training material is detailed in Supplementary Table S4. In the first input setting, (i), all 45 N-1-methyladenosine (m1A) signatures from tRNA (already averaged for isotypes), rRNA and synthetic oligoribonucleotides were merged with 45 random non-m1A instances. The isotype averaging ensures that for any distribution of the data into training and testing sets, the classifier is facing unseen data in a test run. From (i), setting (ii) was derived, which allowed only non-m1A of a minimum m1A signature resemblance w.r.t. at least one of the thresholds a ≥ 0.2, m ≥ 0.2 or at least two mismatch type with ≥ 0.1 share of an m ≥ 0.1. Setting (iii) corresponded to (i) except that the training set was generated from tRNA instances (Saccharomyces cerevisiae cytosolic and Homo sapiens mitochondrial) only, while the test set contained rRNA sites (S. cerevisiae, S. pactum) exclusively. To demonstrate the advantage of our prediction model, we compared the supervised prediction power of the RF with that of a basic k-nearest neighbor (kNN) classifier (Supplementary Figure S7). |
| References |
[1]. The reverse transcription signature of N-1-methyladenosine in RNA-Seq is sequence dependent. Nucleic Acids Res. 2015 Nov 16;43(20):9950-64. |
| Additional Infomation |
1-methyladenosine is a methyladenosine carrying a methyl substituent at position 1. It has a role as a human metabolite. It is functionally related to an adenosine. 1-Methyladenosine has been reported in Daphnia pulex, Bos taurus, and other organisms with data available. 1-Methyladenosine is a metabolite found in or produced by Saccharomyces cerevisiae. At the current state, our machine learning algorithm can distinguish N-1-methyladenosine (m1A) from an unmodified adenosine with very good accuracy, if these two possibilities are the only elements in the training data. Not unexpectedly, when other modifications are forcibly included as non-m1A training data, the performance drops. The erroneous classification of an m6,6A as m1A is readily rationalized: m6,6A carries a methyl group on its Watson–Crick face, and therefore leads to RT-arrest as well. Furthermore, a previous study suggests that all the adenosine modifications have similar misincorporation patterns. The latter argument must be attenuated somewhat, since our current analysis shows strong variability even within m1A samples (Supplementary Figure S4). Still, this instance once more illustrates, that once a candidate site is identified, further evidence, such as sequence homology to known sites, RNA-Seq data from relevant knockout organisms, or biochemical analysis is needed for confirmation. The performance of a prospective large-scale prediction depends on the quality and quantity of both, positive and negative training instances. Our N-1-methyladenosine (m1A) pool covers a large number of sequence contexts, but is clearly biased in that some portions of the sequence space are missing in the training pool. Obviously, the sequence context of m1A occurrence in nature is not random, but biased by biological evolution, e.g. of the m1A methyltransferases. Since the algorithm is based on learning, its current version will be more successful at predicting m1A sites situated in a similar sequence context, and it is prone to perform poorly in the prediction of sites in a radically new sequence context, including in particular such situated in clusters containing multiple different modifications. The training pool of non-m1A instances determines the success along similar lines. [1] |
Solubility Data
| Solubility (In Vitro) | DMSO : ~150 mg/mL (~533.30 mM) |
| Solubility (In Vivo) |
Solubility in Formulation 1: ≥ 2.08 mg/mL (7.40 mM) (saturation unknown) in 10% DMSO + 40% PEG300 + 5% Tween80 + 45% Saline (add these co-solvents sequentially from left to right, and one by one), clear solution. For example, if 1 mL of working solution is to be prepared, you can add 100 μL of 20.8 mg/mL clear DMSO stock solution to 400 μL PEG300 and mix evenly; then add 50 μL Tween-80 to the above solution and mix evenly; then add 450 μL normal saline to adjust the volume to 1 mL. Preparation of saline: Dissolve 0.9 g of sodium chloride in 100 mL ddH₂ O to obtain a clear solution. Solubility in Formulation 2: ≥ 2.08 mg/mL (7.40 mM) (saturation unknown) in 10% DMSO + 90% (20% SBE-β-CD in Saline) (add these co-solvents sequentially from left to right, and one by one), clear solution. For example, if 1 mL of working solution is to be prepared, you can add 100 μL of 20.8 mg/mL clear DMSO stock solution to 900 μL of 20% SBE-β-CD physiological saline solution and mix evenly. Preparation of 20% SBE-β-CD in Saline (4°C,1 week): Dissolve 2 g SBE-β-CD in 10 mL saline to obtain a clear solution. Solubility in Formulation 3: ≥ 2.08 mg/mL (7.40 mM) (saturation unknown) in 10% DMSO + 90% Corn Oil (add these co-solvents sequentially from left to right, and one by one), clear solution. For example, if 1 mL of working solution is to be prepared, you can add 100 μL of 20.8 mg/mL clear DMSO stock solution to 900 μL of corn oil and mix evenly. (Please use freshly prepared in vivo formulations for optimal results.) |
| Preparing Stock Solutions | 1 mg | 5 mg | 10 mg | |
| 1 mM | 3.5553 mL | 17.7765 mL | 35.5530 mL | |
| 5 mM | 0.7111 mL | 3.5553 mL | 7.1106 mL | |
| 10 mM | 0.3555 mL | 1.7777 mL | 3.5553 mL |